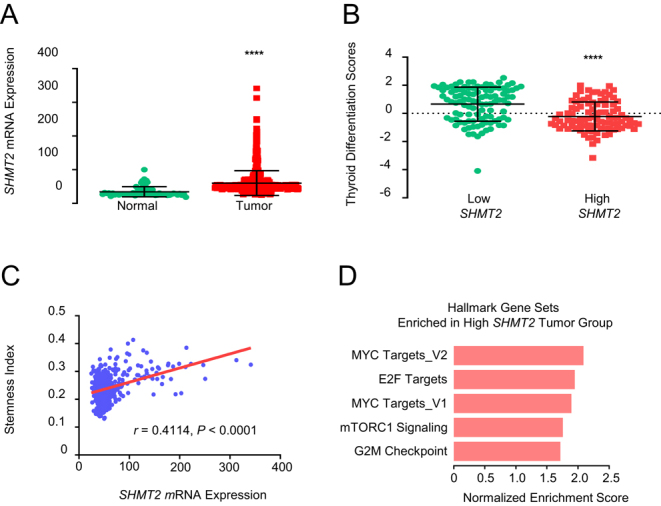
Figure 3.

Analysis of serine hydroxymethyltransferase2 (SHMT2) mRNA expression in The Cancer Genome Atlas (TCGA) data. (A) Comparison of mRNA expression of SHMT2 between normal thyroid (n = 59) and tumor tissue (n = 505). (B) Comparison of thyroid differentiation scores between low (n = 103) and high (n = 95) SHMT2 tumor groups. (C) Correlation between SHMT2 expression and stemness index using Pearson coefficient (n = 500). (D) Enriched hallmark gene sets (P < 0.05 and P < 0.10) in the high SHMT2 tumor group compared to the low SHMT2 group. Asterisks (P < 0.001 (****)) indicate significant differences from the statistical analyses. THCA, thyroid carcinoma.

 This work is licensed under a