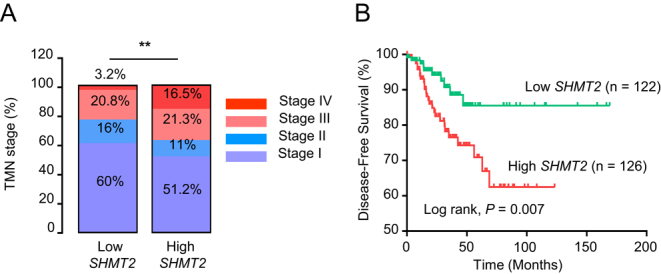
Figure 4.

Clinical outcomes according to serine hydroxymethyltransferase2 (SHMT2) mRNA expression from The Cancer Genome Atlas (TCGA) data. (A) Comparison of TNM stages between low and high SHMT2 tumor groups. (B) Comparison of disease-free survival between low and high SHMT2 tumor groups. Asterisks (P < 0.01 (**)) indicate significant differences. THCA, thyroid carcinoma.

 This work is licensed under a