Figure 1.
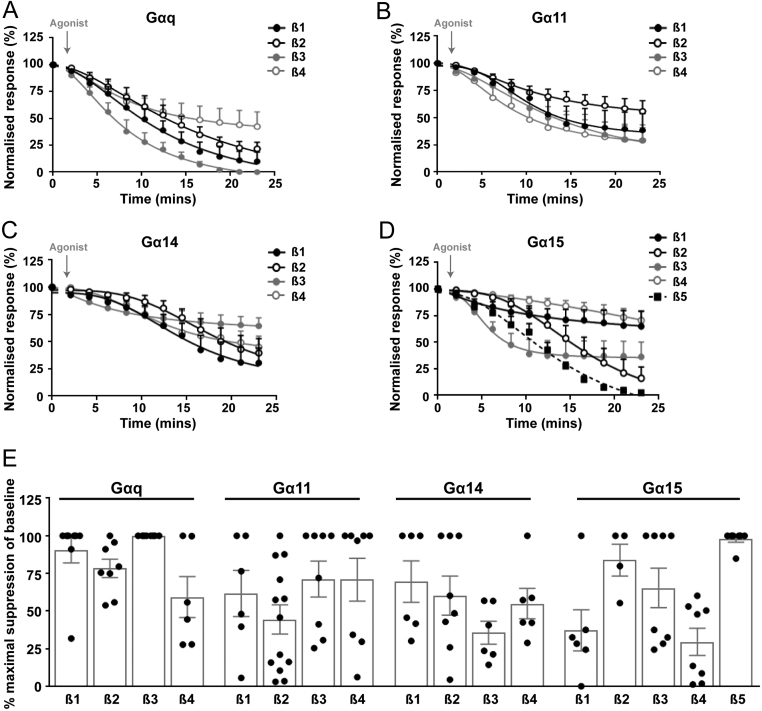
CaSR activation of the Gq/11 family by NanoBiT G protein dissociation assays. NanoBiT dissociation assays of AdHEK-CaSR cells transiently transfected with: (A) LgBiT-Gαq, (B) LgBiT-Gα11, (C) LgBiT-Gα14, (D) LgBiT-Gα15 with SmBiT-Gβ subunits (Gβ1–5) and unlabelled Gγ2 following treatment with 5 mM Ca2+e. Pre-calcium baselines are not shown. The first baseline value is shown. (E) Percentage suppression of baseline from A, B, C and D. Statistical analyses comparing values of all Gα-Gβ dissociations are shown in Supplementary Table 1. For all panels only those Gα and Gβ pairs that yielded relative luminescence units (RLU) over a threshold of 1 × 10³ (i.e. above background luminescence) are shown. All responses were normalised to those under basal conditions (0.1 mM Ca2+e). Dissociation curves for 5 mM Ca2+e are shown (curves with 0.1 mM Ca2+e are shown in Supplementary Fig. 7). Curves show mean±s.e.m. for n = 6–11 independent assays.

 This work is licensed under a