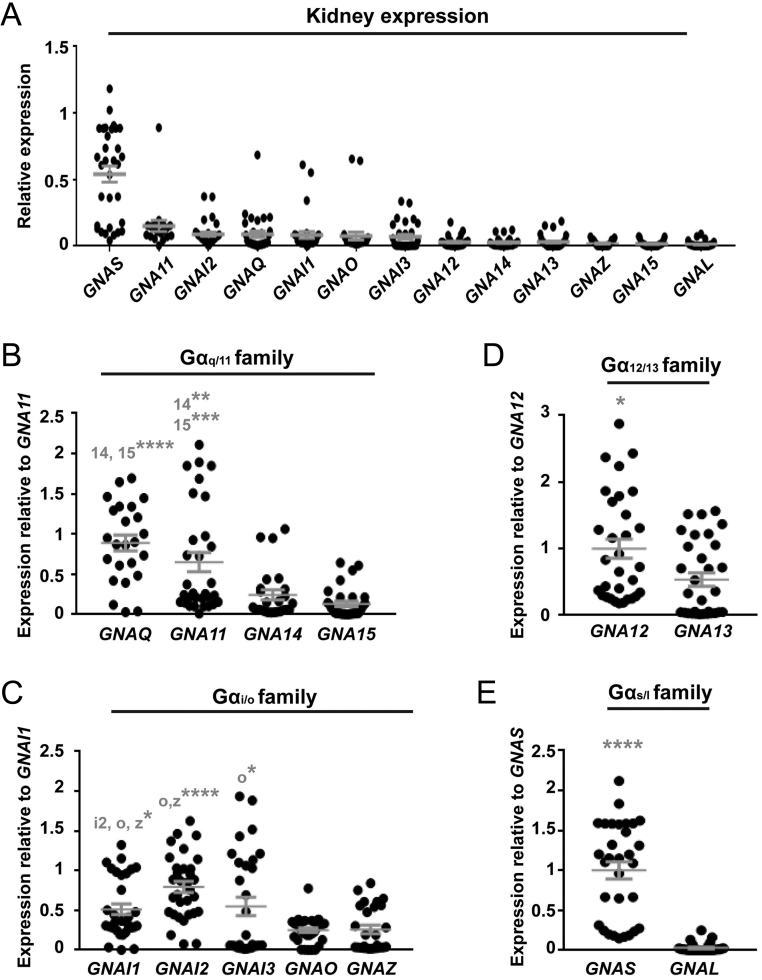
Figure 6.
Expression of G protein α-subunits in human kidney tissue. (A) The mRNA expression of 13 Gα-subunits in human kidney tissue shown as a relative fold-change compared to the geometric mean of control genes. Statistical analyses comparing expression between subunits is shown in Supplementary Table 2. (B, C, D and E) To compare expression of genes within subfamilies, each gene was expressed as a fold-change compared to either: (B) GNA11; (C) GNAI1; (D) GNA12; and (E) GNAS. Statistical analyses were performed by one-way ANOVA and subunits with which comparisons are made are indicated in grey. ****P < 0.0001, ***P < 0.001, **P < 0.01, *P < 0.05.

 This work is licensed under a