Figure 3.
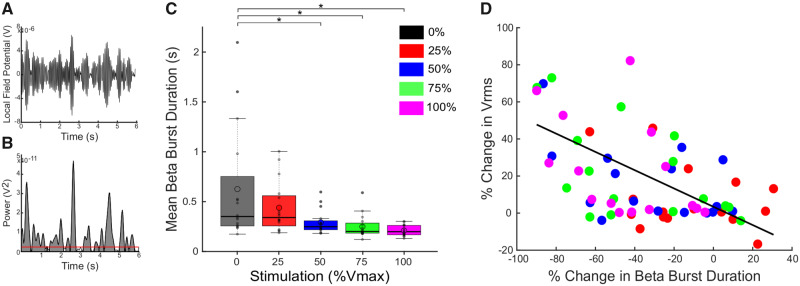
DBS reduced movement band burst durations during rWFE and shorter burst durations were associated with improvement in bradykinesia. (A) Bandpass filtered LFP in the 6 Hz movement band during a portion of the rWFE task. (B) Envelope of the squared movement band filtered signal in A. The red horizontal line denotes the baseline used for burst identification. Shaded grey regions represent identified bursts. (C) Box plots with individual data overlaid depicting the movement band burst durations for each stimulation intensity. DBS progressively reduced movement band mean burst duration, with significant differences occurring at 50%, 75%, and 100% Vmax. (D) There was a significant correlation between the % change in movement band burst duration and % change in Vrms as calculated by the linear mixed model (P < 0.001). Thick horizontal line represents the median and the open circle represents the mean. *P < 0.05.

