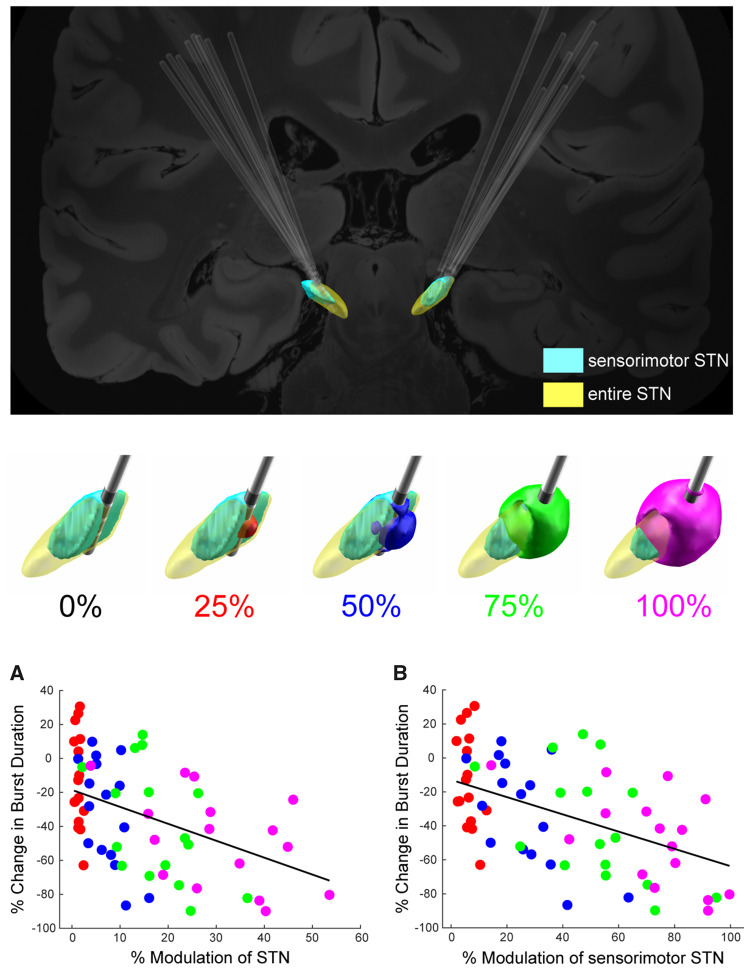
Figure 4.
Change in beta power and burst duration was dependent on theoretical amount of tissue modulated in entire STN and sensorimotor STN. Top: DBS lead placement targeting sensorimotor STN (light blue) for all STN leads. Middle: Example of the VTM in one STN at 0%, 25% (red), 50% (blue), 75% (green), and 100% (magenta) Vmax overlaid on the STN. The whole STN is depicted in yellow and the sensorimotor region is highlighted in light blue. Bottom: (A) Relationship between % change in movement band power and % modulation of the STN. (B) Relationship between the % change in movement band burst duration and % modulation of the sensorimotor portion of the STN. The % modulation of both the STN as a whole and of the sensorimotor region of the STN significantly predicted the change in burst duration, P < 0.001, with the stronger relationship observed for the sensorimotor portion of the STN.

