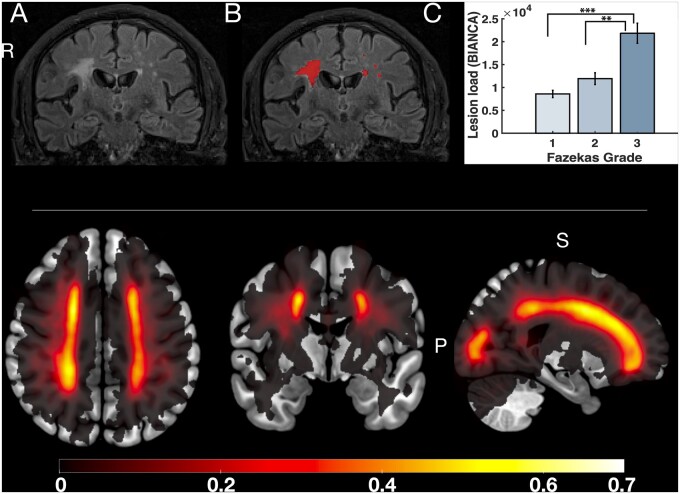
Figure 3.
Quantification of disease severity using white matter lesion load. Top: A representative FLAIR sequence before and after applying BIANCA, an automated classification algorithm, to detect white matter lesions (A and B, respectively). Lesion load was calculated by applying a threshold of 80% to minimize false positives (B). This measure was validated against clinician-scored Fazekas gradings, and demonstrated significant increases in lesion load with higher Fazekas scores (C). Bottom: Group lesion heat map representing probability of white matter lesion presence (see colour bar) across the whole patient group. Axial, coronal and sagittal views from left to right.

