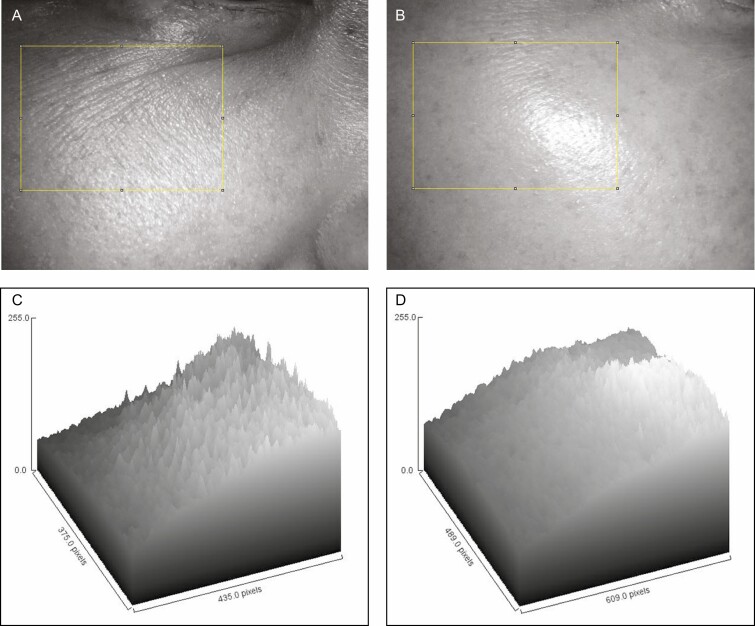
Figure 2.
The changes in roughness (A, C) before and (B, D) 1 month after the treatment of this 42-year-old woman (the same patient shown in Figure 3). (A, B) Dermatoscopic photos 10×. The yellow box above can be exhibited in computer topographic microscopic photos (C, D). This tool plots characteristics of the surface roughness for each column. Utilizing column statistics of the Gwyddion computer program in the same area, mean roughness of all patients was reduced by 51.9% at 1 month posttreatment from 7.81 ± 0.95 to 3.89 ± 0.43. (Ra: roughness average of the yellow box, a parameter of the Gwyddion computer program).

