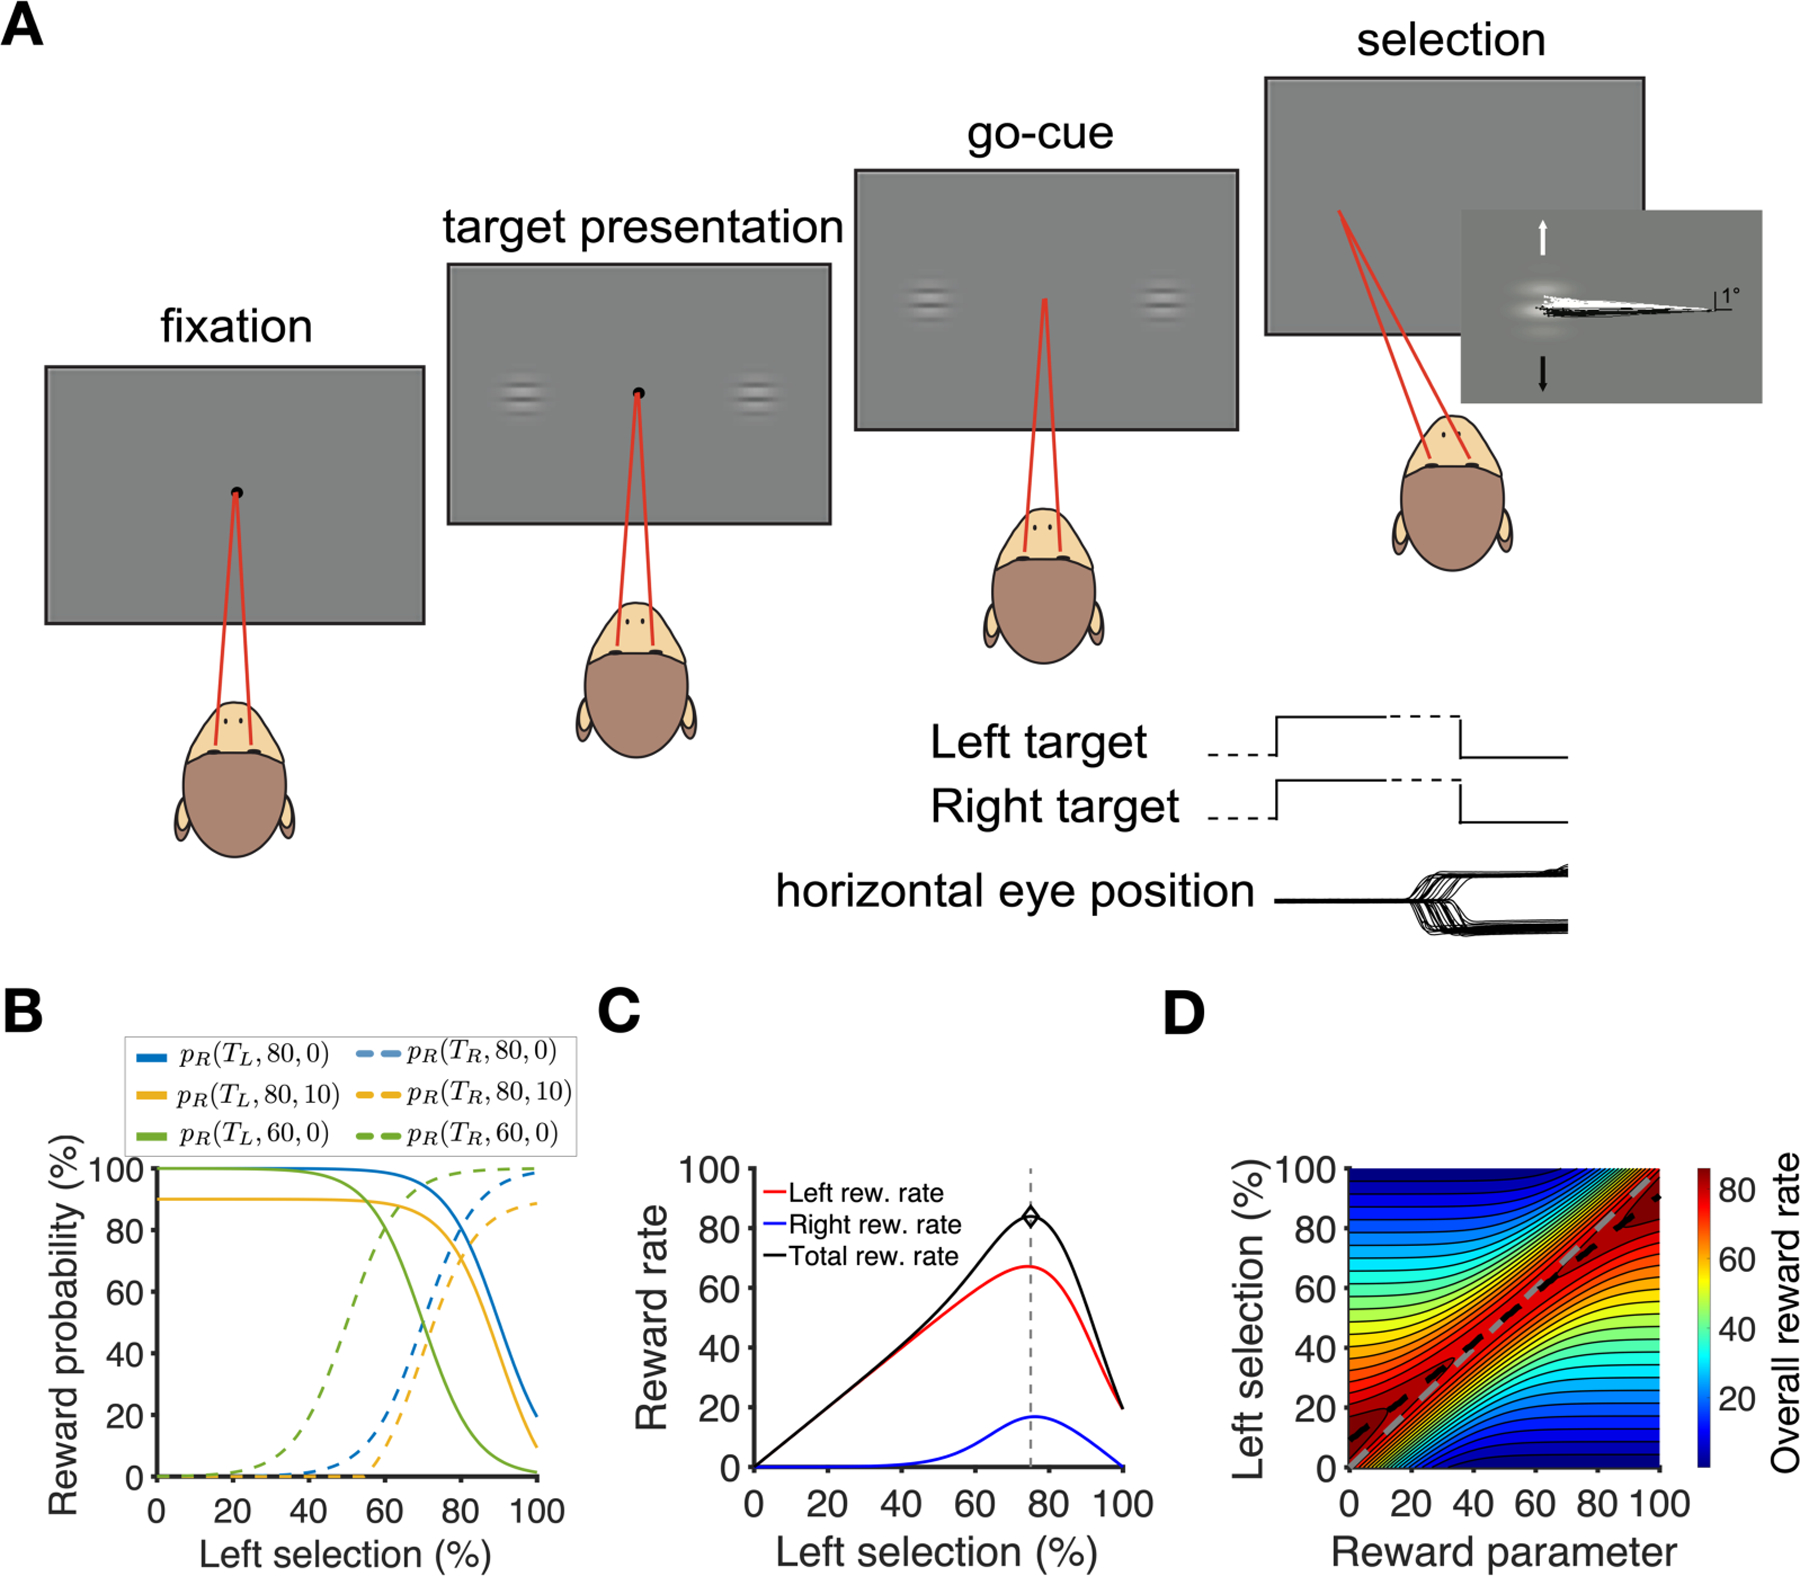
Figure 1.

The free-choice task and reward schedule example. (A) Task design. On each trial, a fixation point appeared on the screen, followed by the presentation of two drifting-grating targets. The monkeys indicated their selection with a saccade. Targets were extinguished at the onset of the saccade. A juice reward was delivered on a variable schedule following the saccade. Event plots indicate the sequence of presentation of the visual targets; dashed lines denote variable time intervals. Horizontal eye position traces are from a subset of trials of an example experiment, and show selection saccades to both left target (TL, downward deflecting traces) and right target (TR, upward deflecting traces). (B) Examples of reward probability as a function of the percentage of left choices, separately for left and right targets (pR(TL, r, x) and pR(TR, r, x)) for different values of reward parameter r and penalty parameter x (see Eq. 1). (C) Plotted is the reward harvest rate on each target as a function of the percentage of TL selections, f(TL), for r=80 and x=0. (D) Total reward harvest rate as a function of reward parameter r and the percentage of TL selections for x=0. The gray dashed line shows f(TL) = r corresponding to matching behavior. The black dashed line indicates the percentage of TL selections that results in the optimal reward rate. Slight undermatching corresponds to optimal choice behavior in this task.
