
Figure 2.
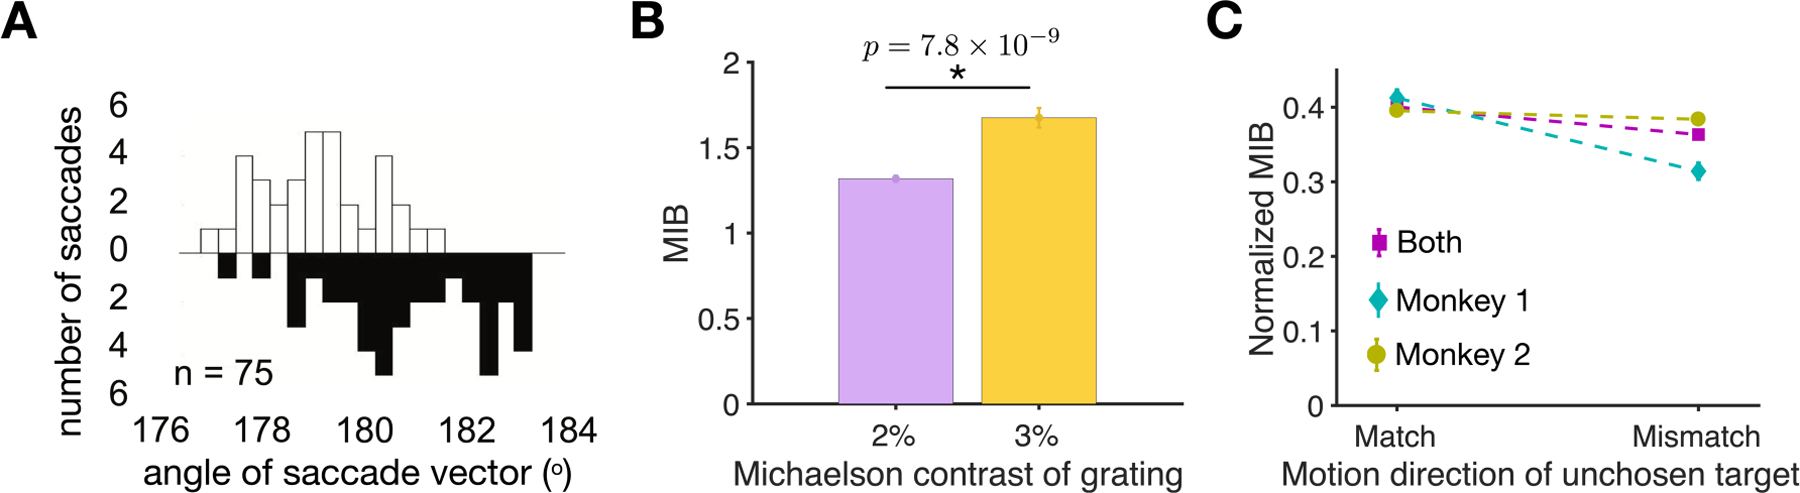
MIB measures sensitivity to visual motion. (A) Plotted are the example distributions of the angle of saccade vector (relative to the fixation dot) for upward (open) and downward (filled) drifting targets. (B) MIB significantly increased as the contrast of grating is increased from 2% (purple) to 3% (yellow). (C) Comparison of the z-score normalized MIB when the directions of motion in the chosen and nonchosen targets matched or did not match. The MIB is z-score normalized for each monkey separately within each session.