Figure 3.

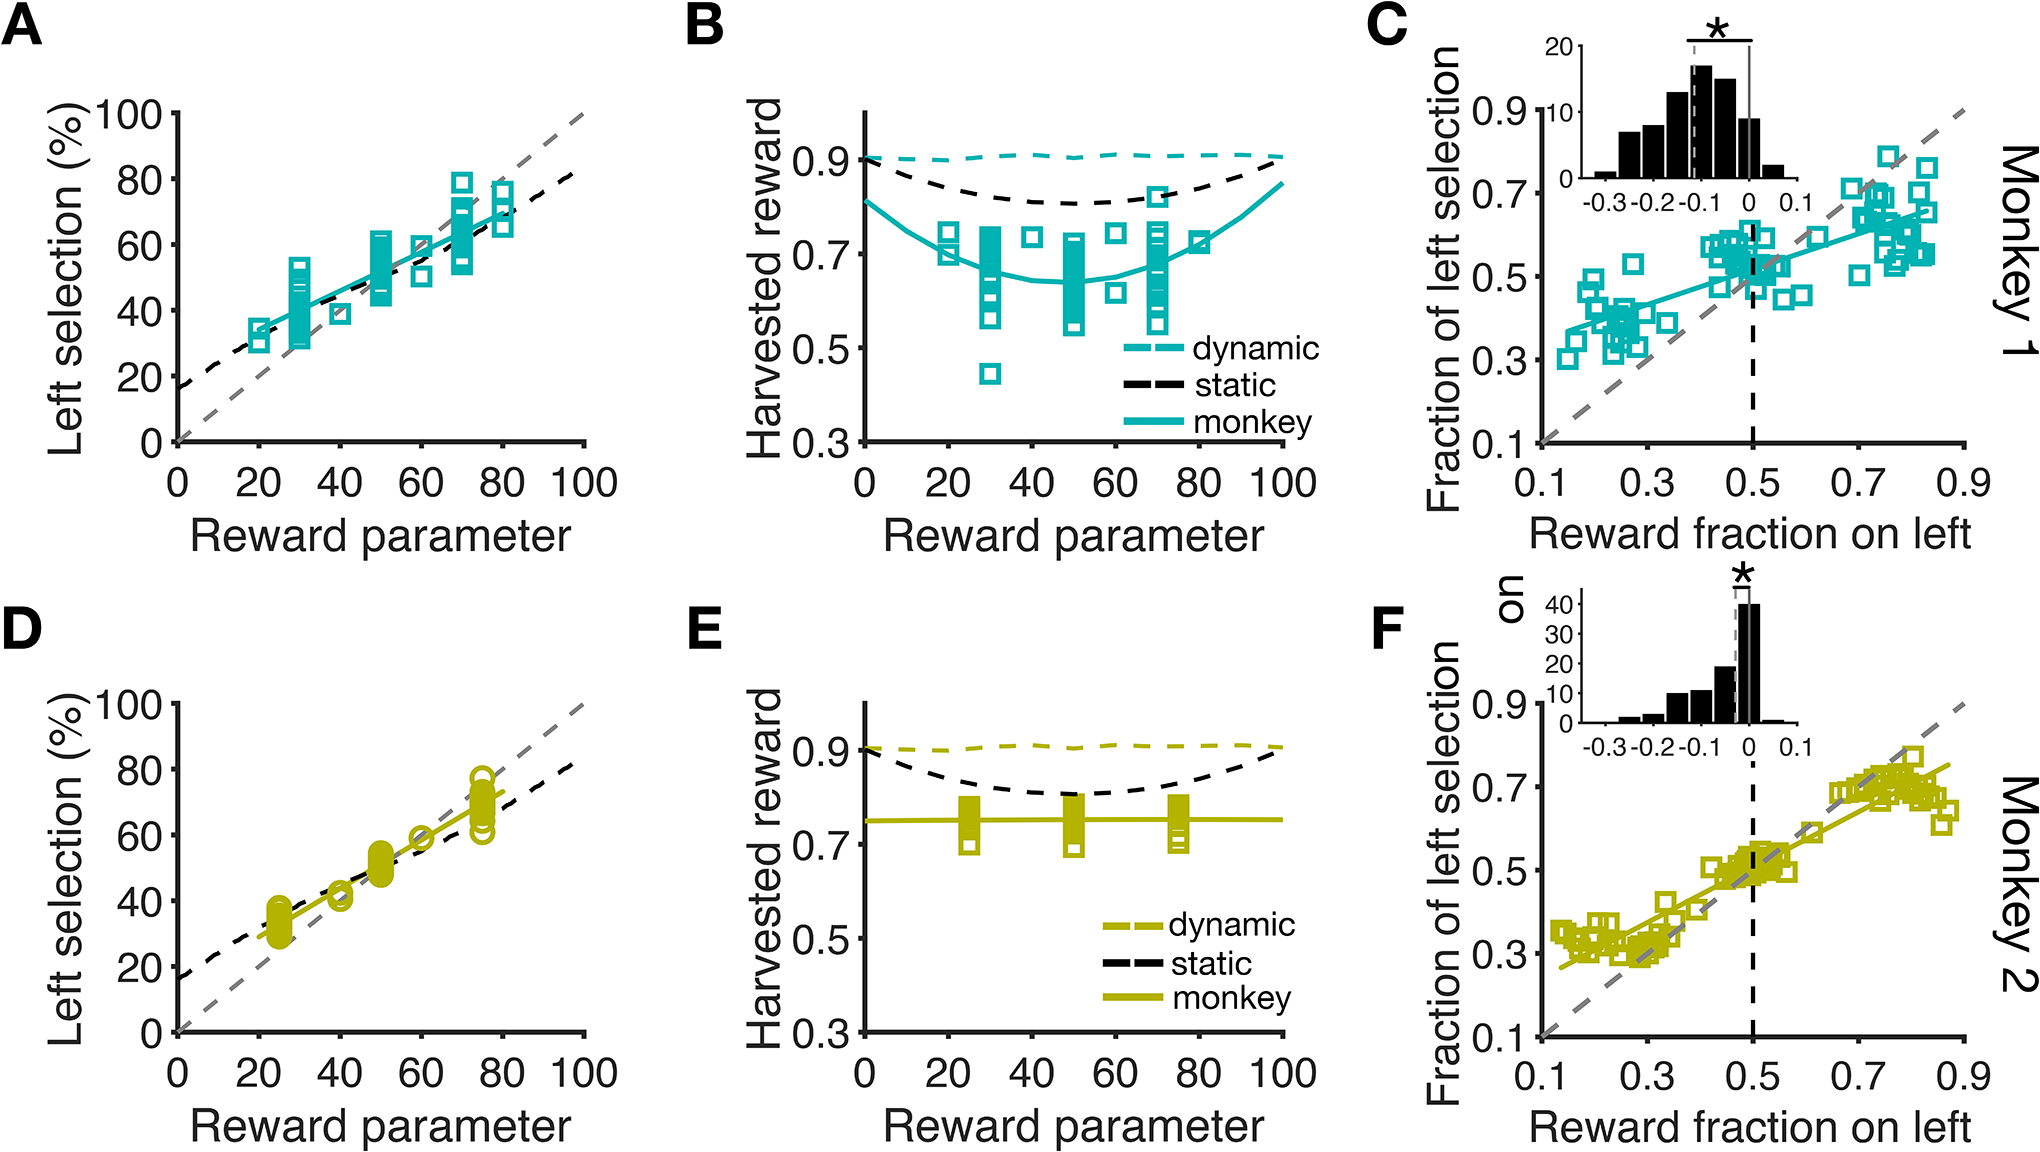
Global (session-wise) effects of reward on choice behavior. (A) Choice behavior was sensitive to reward parameter. Percentage of TL selections is plotted as a function of r, which varied across experimental sessions for monkey 1. The colored lines are linear fits, and the black dashed line shows the optimal f(TL) for a given value of r assuming selection between the two targets with a fixed probability (optimal static model). The gray dashed line shows unit slope. Each data point correspond to one session of the experiment. (B) The overall performance was suboptimal. Plotted is harvested rewards per trial as a function of reward parameter r for zero penalty sessions for monkey 1. The solid colored lines show fit using a quadratic function. The colored and black dashed lines indicate harvested reward rates of the optimal dynamic and static models, respectively. (C) Proportion of TL selections is plotted as a function of the fraction of harvested reward on the left target. The colored lines are linear fits and the gray dashed line shows the diagonal line corresponding to matching behavior. Monkey 1 showed significant under-matching by selecting the more rewarding target with a choice fraction smaller than reward fraction. The inset shows the difference between choice and reward fractions with negative and positive values corresponding to under- and over-matching. The gray dashed lines indicate the medians of the distributions and asterisks show the significant difference from 0 (i.e. matching) using Wilcoxon signed rank test (p<.05). (D–F) Similar to panels A–C but for monkey 2.
