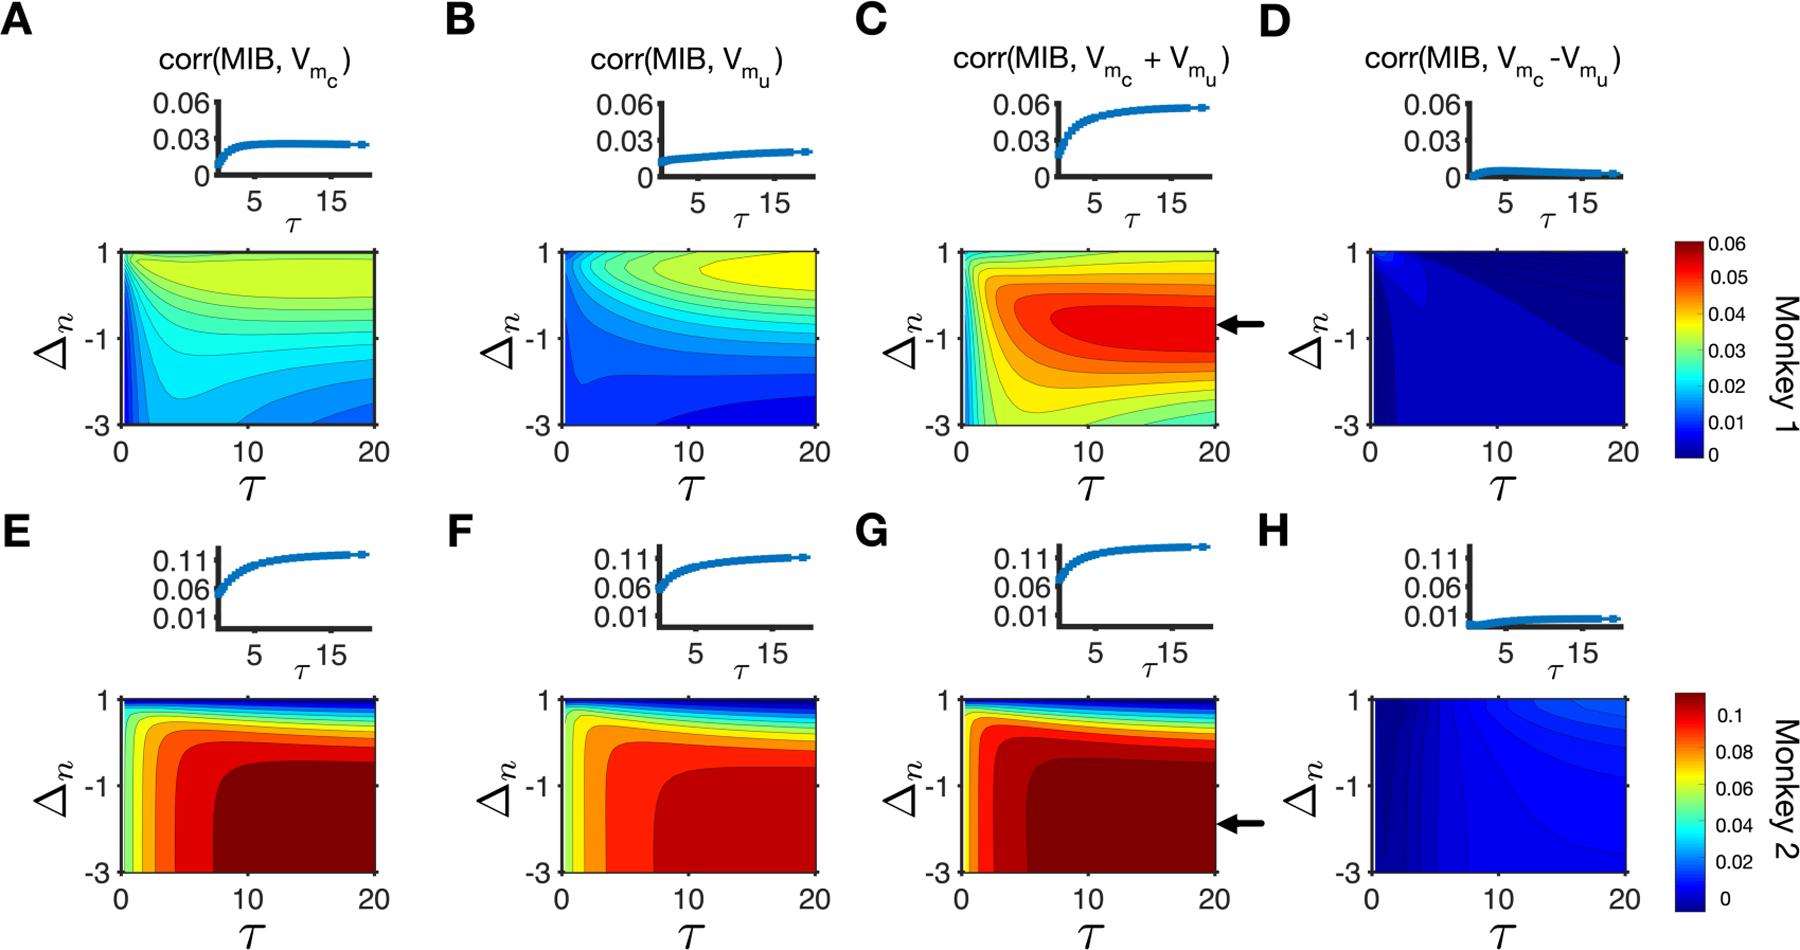
Figure 5.

MIB was most strongly correlated with the sum of subjective reward values of the two targets based on return. (A–D) Plotted are the correlations between the MIB and subjective reward values of the chosen (A) and unchosen (B) targets based on return, and their sum (C) and their difference (D) for different values of τ and Δn. The inset in each panel shows the correlation between the MIB and the corresponding subjective return values for different values of τ and a specific value of Δn (indicated with an arrow in the main panel C) for monkey 1. The arrow in panel C points to the value of Δn that results in the maximum correlation between the MIB and sum of subjective return values of the two targets for monkey 1. (E–H) The same as in A–D but for monkey 2. The arrow in panel G points to the value of Δn that results in the maximum correlation between the MIB and sum of subjective return values of the two targets for monkey 2.
