
Figure 6.
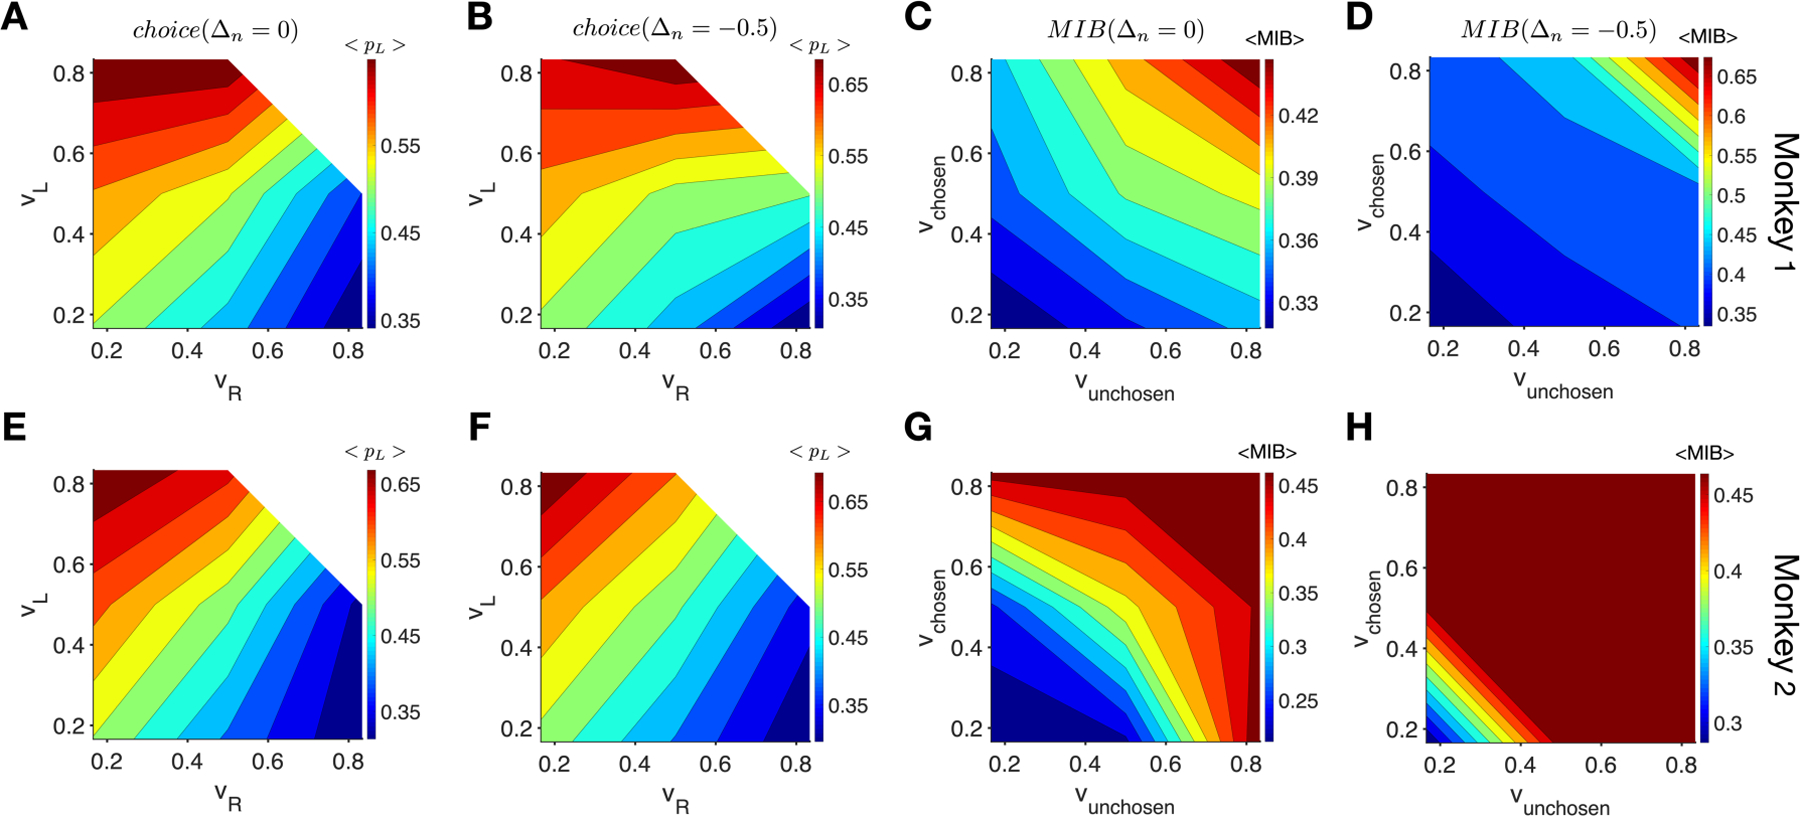
The choice probability for both monkeys was largely determined by the difference in estimated subjective values whereas the MIB was largely determined by the sum of subjective values of targets. (A–B) Plots show the probability of choosing the left target as a function of subjective values of the left and right targets for monkey 1, using τ = 15 and two values of Δn as indicated on the top. (C–D) Plots show the MIB as a function of subjective values of the chosen and unchosen targets for monkey 1, using τ = 15 and two values of Δn as indicated on the top. (E–H) The same as in A–D but for monkey 2.