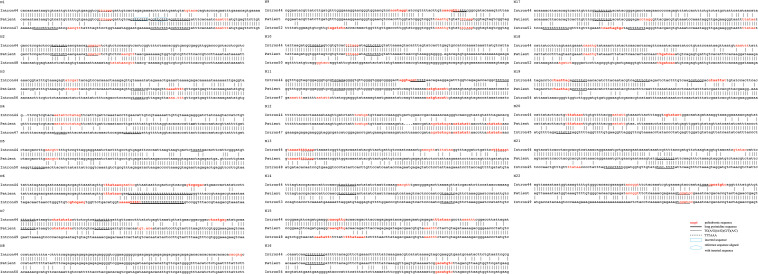
FIGURE 3.
Genomic sequences spanning 22 deletion breakpoints with corresponding reference intron sequences. Only the 5′–3′ strands are shown. Palindromic sequences are presented in red color. Black underlines indicate long pyrimidine sequences, black dotted lines indicate TG(A/G)(A/G)(G/T)(A/C), and red dotted lines indicate TTTAAA. The inserted sequence is highlighted in a blue rectangle and the reference sequence that was aligned with the inserted sequence is highlighted in a blue circle.

