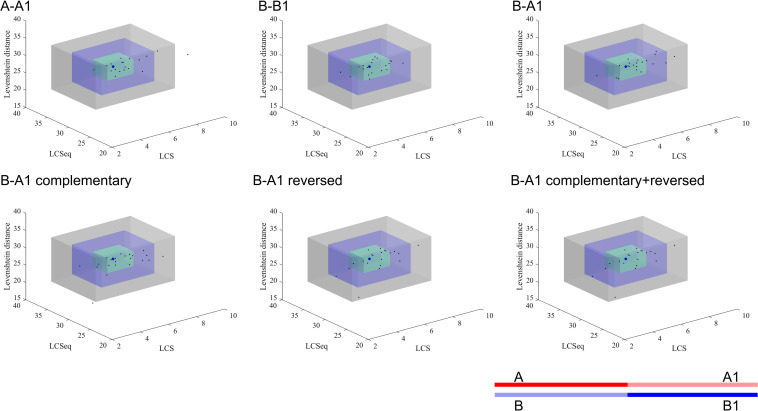
FIGURE 4.
Similarity analyses of subsequences near the breakpoints. The blue dot represents the mean value of the random sequences and each black dot presents the index data of a patient. The green, blue, and gray cuboid indicates 1, 2, and 3 standard deviations from the mean value, respectively. A, A1, B, and B1 represent different segments of the corresponding gene sequences as the legend shows. A: upstream 50 bp of start point; A1: downstream 50 bp of start point of reference sequence; B: upstream 50 bp of end point of reference sequence; B1: downstream 50 bp of end point. The semitransparent lines show the deleted sequences.

