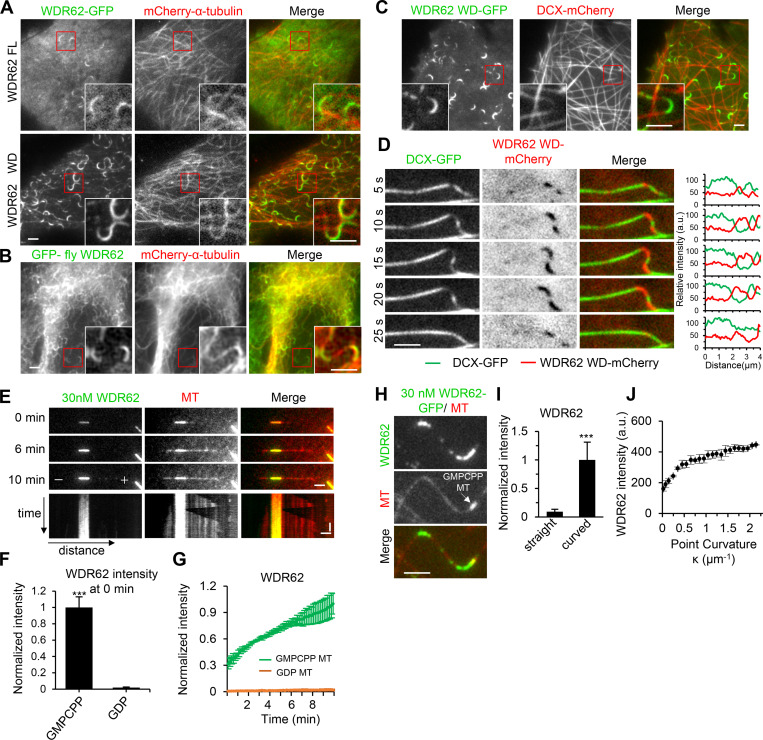
Figure 4.
WDR62 preferentially binds to curved segments of dynamic MTs, as well as GMPCPP-stabilized MTs.(A) TIRF microscopy images of live MRC5 cells expressing GFP-tagged WDR62 FL or its WD40 domain (WD) together with mCherry–α tubulin. Insets show enlargements of the boxed areas. (B) Widefield fluorescence images of fixed MRC5 cell expressing GFP-fly WDR62 together with mCherry–α-tubulin. Insets show enlargements of the boxed areas. (C) TIRF microscopy images of live MRC5 cells expressing WDR62 WD-GFP together with DCX-mCherry. Insets show enlargements of the boxed areas. (D) Left: Time-lapse images showing the disappearance and reappearance of DCX-GFP and WDR62 WD-mCherry to mutually exclusive sites of a single MT, in response to MT buckling and straightening. Right: Corresponding fluorescence intensity profiles of WDR62 WD (red) and DCX (green) obtained from a line scan along the MT. (E) TIRF microscopy time-lapse images and kymograph showing gradual accumulation of WDR62-GFP (30 nM) on GMPCPP seed but not on the dynamic GDP lattice grown from the seed in a standard dynamic MT assay. (F) Quantification of WDR62-GFP intensity on GMPCPP seeds and GDP lattices at 0 min as shown in E. The values were normalized to the intensity on GMPCPP seeds. n = 23 MTs from three experiments. (G) Plot of WDR62-GFP intensity on GMPCPP seeds and GDP lattices against time. n = 23 MTs from three experiments. (H and I) TIRF microscopy images showing the preferential binding of WDR62-GFP (30 nM) to curved but not straight segments of dynamic GDP lattice in a flow-in assay (H) and quantification of the intensities of WDR62-GFP on straight and curved segments of GDP lattices (I). The arrow in H denotes the GMPCPP seed. The values were normalized to the intensity of curved segments. n = 87 MTs from three experiments. (J) Plot of WDR62-GFP intensity against the MT curvature κ, as shown in H. n = 31 MTs from three experiments. Horizontal scale bars, 2 µm; vertical scale bar, 2 min. Data represent mean ± SD. ***, P < 0.001; two-tailed t test.

