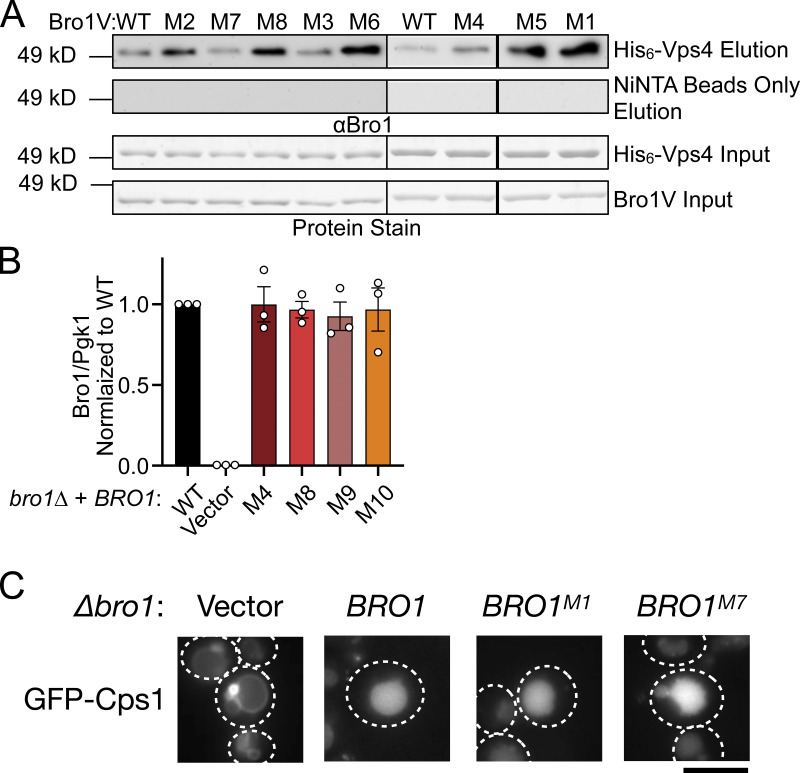
Figure S4.
Bro1V mutants bind Vps4. This figure complements Figs. 5 and 6. (A) Immobilized His6-Vps4 or Ni-NTA beads alone were incubated with Bro1V WT or Bro1V mutants, and bound material was analyzed by immunoblotting with anti-Bro1 antiserum. M, mutant. (B) Mutant protein expression levels normalized to WT. Bro1 expression levels were normalized to Pgk1 and subsequently normalized to WT/Pgk1 ratios. Quantified from three independent experiments performed on three different days from two sets of transformations. Data are represented as mean ± SEM. Immunoblots were probed against Bro1 and PGK1 using lysates of GOY65 transformed with empty plasmid (pRS414) or BRO1, bro1M4, bro1M8, bro1M9, or bro1M10 plasmids. Statistical analyses did not reveal differences between WT and mutant forms of Bro1. (C) bro1Δ (GOY65) cells were transformed with GFP-Cps1 and vector, BRO1, BRO1M1, or BRO1M7 plasmids to assess the impact of these mutations on GFP-Cps1 sorting. White dashed lines indicate cell boundaries. Scale bar = 5 µm.

