Figure 4.
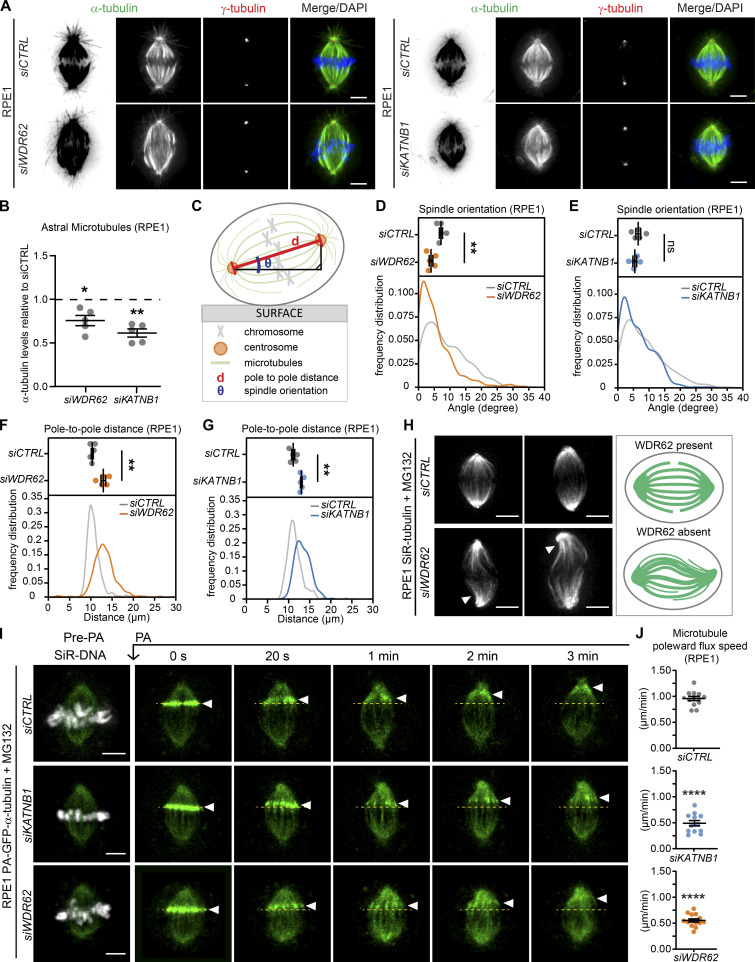
WDR62 loss impairs microtubule minus-end depolymerization.(A) Immunofluorescence images of RPE1 cells treated with indicated siRNAs stained with antibodies against α- and γ-tubulin and DAPI. (B) Quantification of astral microtubules in siWDR62 and siKATNB1 relative to siCTRL; N = 5, n = 244–281 cells; dot plot represents median per experiment; bars represent mean ± SEM; *, P < 0.05; **, P < 0.01, two-tailed paired t test. (C) Scheme representing mitotic spindle orientation as the angle from the surface (θ) and the pole-to-pole distance (d). (D–G) Quantification of spindle orientation (D and E) and pole-to-pole distances (F and G) in siCTRL-, siKATNB1-, and siWDR62-treated RPE1 metaphase cells. Dot plots show medians per experiment; curves the frequency distribution; N = 5; n = 315–323 cells; bars represent mean ± SEM; **, P < 0.01 in two-tailed unpaired t test. (H) Immunofluorescence image of siCTRL- or siWDR62-treated MG132 arrested RPE1 cells labeled with SiR-tubulin, and representative spindle architecture scheme indicating microtubule buckling in the spindle of siWDR62-treated cells. (I) Time-lapse images of RPE1 PA-GFP-α-tubulin cells treated with indicated siRNAs and MG132, labeled with SiR-DNA, and photoactivated (PA) at t = 0. (J) Quantification of the microtubule poleward flux speed (μm/min): N = 3, n = 12–14 cells; dot plots represent each cell; bars represent mean ± SEM; ****, P < 0.0001, two-tailed paired t test. All scale bars = 5 µm. See also Video 1, Video 2, and Video 3.

