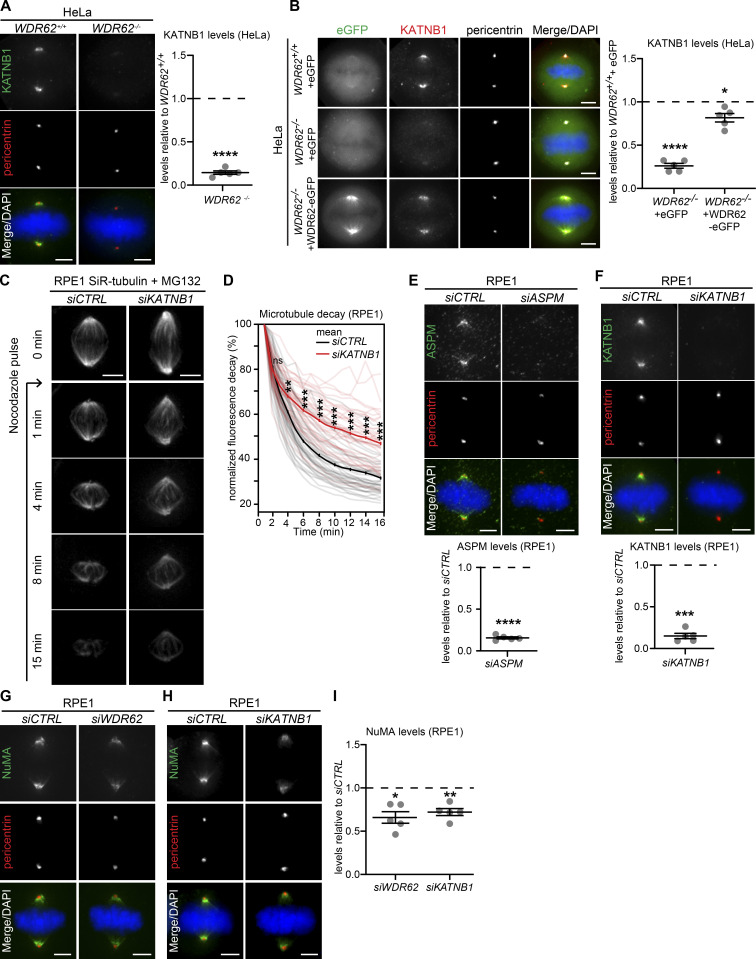
Figure S2.
KATNB1 depletion mimics WDR62 depletion. Related to Fig. 3. (A) Immunofluorescence images of metaphase WDR62+/+ and WDR62−/− HeLa cells, stained with KATNB1 and pericentrin antibodies and DAPI (left); quantification of KATNB1 levels in WDR62−/− relative to WDR62+/+(right): N = 5, n = 308 (WDR62+/+) and 292 (WDR62−/−) cells; dot plot represents median per experiments; bars represent mean ± SEM; ****, P < 0.0001, two-tailed unpaired t test. (B) Immunofluorescence images of metaphase WDR62+/+ or WDR62−/− HeLa cells transfected with indicated constructs and stained with KATNB1 and pericentrin antibodies and DAPI (left). Quantification of KATNB1 levels at spindle poles (right) in N = 5, n = 217–228 cells; dot plot represents median per experiment; bars represent mean ± SEM; *, P ≤ 0.05; ****, P < 0.0001, one-way ANOVA. (C) Time-lapse images of MG132-arrested RPE1 cells treated with siCTRL and siKATNB1, labeled with SiR-tubulin, and treated with 200 ng/ml of nocodazole at t = 0. (D) Quantification of the spindle microtubule decay over time in siCTRL- and siWDR62-treated RPE1 metaphase cells: N = 4, n = 50 (siCTRL) and 55 (siKATNB1) cells; thick line represents mean; thin line represents single experiments; *, P < 0.05; **, P < 0.01; ***, P < 0.001, repeated two-tailed paired t test. (E–I) Immunofluorescence of metaphase RPE1 cells treated with indicated siRNAs, stained with DAPI and antibodies against pericentrin and ASPM (E), KATNB1 (F), or NuMA (G and H); all quantifications (E and F below, and I right) represent the levels in the indicated siRNA vs. siCTRL: N = 5, n = 303–323 cells; dot plots represent median per experiments; bars represent mean ± SEM; *, P < 0.05; **, P < 0.01; ***, P < 0.001; ****, P < 0.0001, in two-tailed paired t test. All scale bars = 5 µm.

