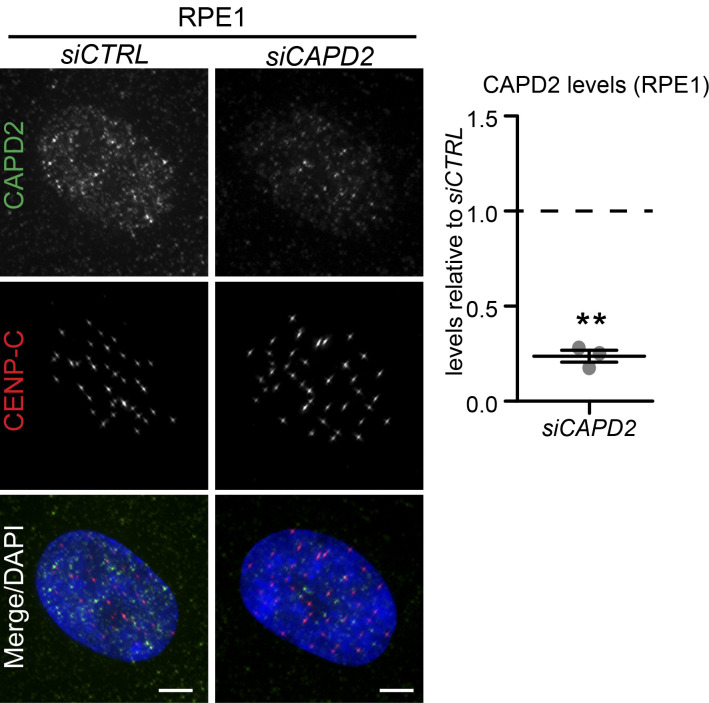
Figure S4.
Validation of CAPD2 depletion in RPE1 cells. Related to Fig. 5. Immunofluorescence images of interphase RPE1 cells treated with siCTRL and siCAPD2 and stained with CAPD2 and CENP-C antibodies and DAPI (left); quantification of CAPD2 levels in siCAPD2 relative to siCTRL (right): N = 3, n = 125 cells per condition; dot plot represents median per experiment; bars represent mean ± SEM; **, P < 0.01, two-tailed paired t test. Scale bars = 5 µm.

