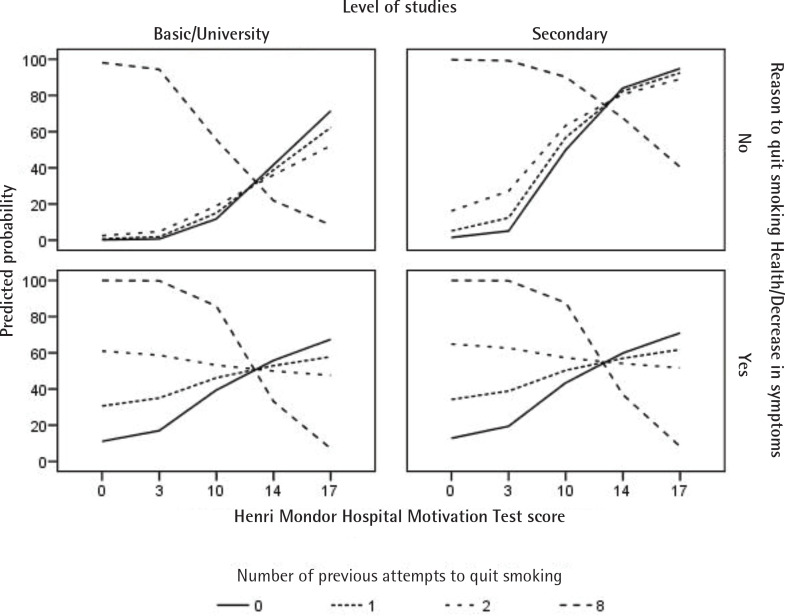
Figure 2.
Graphic representation of the distribution of predicted probabilities according to the model in Table 2 for the different combinations of values of dummy subjects of the variables Henri Mondor Paris Motivation Test, Number of previous quit attempts, Level of studies, and Reason to quit smoking (Health/decrease in symptoms)

