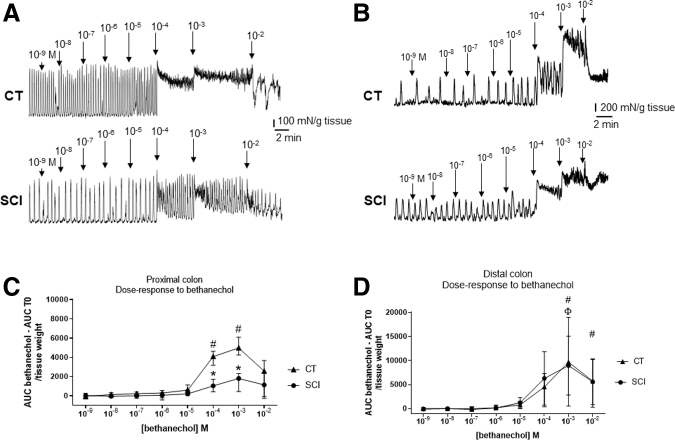
FIG. 5.
Example of evolution of spontaneous contractions under increasing concentrations of bethanechol in proximal (A) and distal (B) colon, in the two groups, spinal cord injury (SCI) and control (CT). Evolution of the area under the curve (AUC) at the different concentrations of bethanechol, in the proximal colon of the two groups. AUC T0 = area under the initial curve, before drug application (# and Φ for response significantly different from the initial AUC and * for significantly different response between SCI and CT groups) (C). Evolution of the AUC at the different concentrations of bethanechol, in the distal colon of the two groups. AUC T0 = area under the initial curve, before drug application (#and Φ for response significantly different from the initial AUC and * for significantly different response between SCI and CT groups) (D). Example of dose-response to bethanechol in proximal colon of CT and SCI rats.

