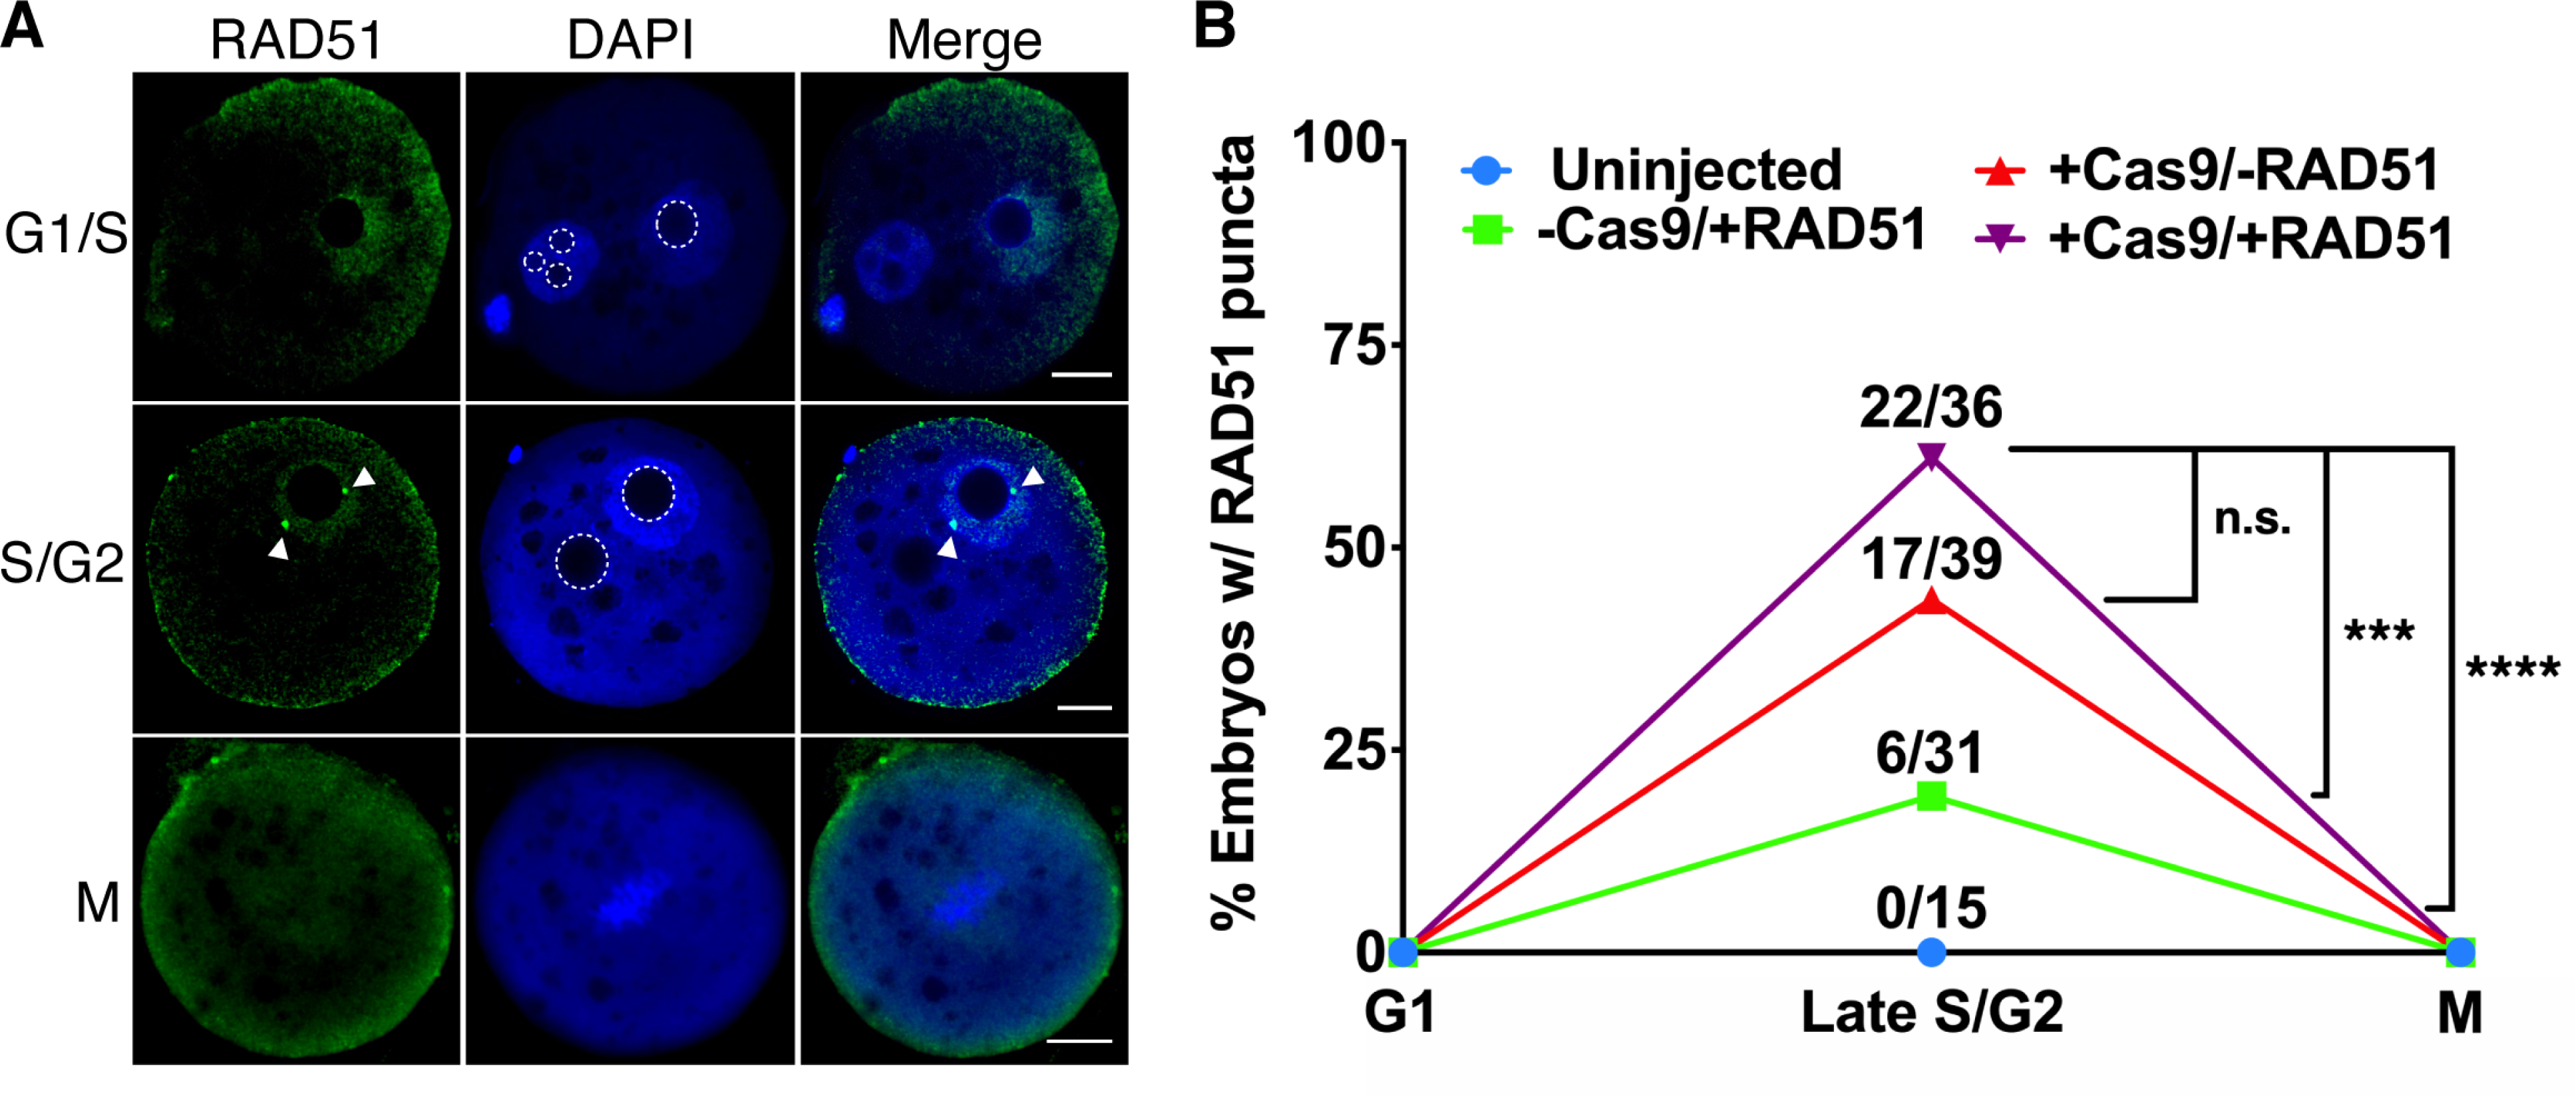
Figure 4. RAD51 Localizes to Cas9-Induced DSBs During G2 in Zygotes.

(A) Representative images of RAD51 immunocytochemistry in G1/S, S/G2, and M-phase zygotes injected with Cas9 and RAD51. Arrowheads indicate RAD51 puncta. Dotted lines highlight pronuclear nucleoli. (Scale bar=10μm) (B) Quantification of zygotes positive for RAD51 puncta (one-sided Fisher’s exact test). ***p<0.001, ****p<0.0001, n.s. p>0.05
