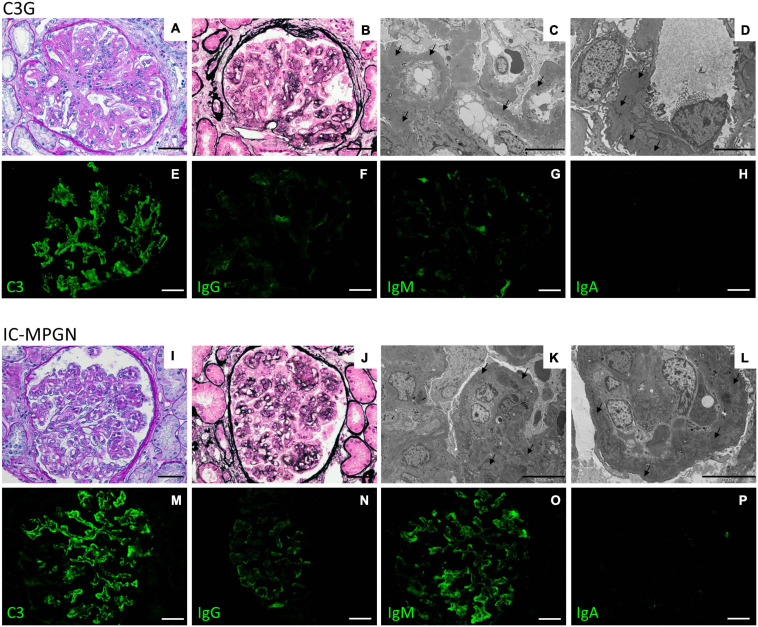
FIGURE 4.
Representative biopsy findings from patients diagnosed with C3GN (upper panel) and IC-MPGN (lower panel). Upper panel: (A,B) C3GN patient. Light microscopy revealed endocapillary proliferation, leukocyte infiltration accompanied by lobulation of the glomerular tuft (A, periodic acid-Schiff staining; B, Jone’s silver staining). (C,D) Electron micrographs show intramembranous, subendothelial and mesangial deposits (arrows). (E–H) Representative immunofluorescence images reveal strong positivity for C3 staining along the capillary tuft (E), while IgG (F), IgM (G), and IgA (H) staining is absent or present only in traces. (Scale bars: 50 μm in A,B,E–H; 10,000 nm in C and 5,000 in D). Lower panel: (I–L) IC-MPGN patient. Light microscopy and electron microscopy findings are similar to those observed in the C3GN patient (I, periodic acid-Schiff staining; J, Jone’s silver staining; K,L, transmission electron micrographs). (M–P) At variance with C3GN patients, immunofluorescence analysis shows the typical pattern of IC-MPGN, with abundant deposition of C3 in the glomerular tuft (M), accompanied by moderate-to-strong positivity for IgG and IgM immunoglobulin staining (N, IgG; O, IgM); IgA staining is negative (P, IgA). (Scale bars: 50 μm in I,J,M–P; 10,000 nm in K,L).

