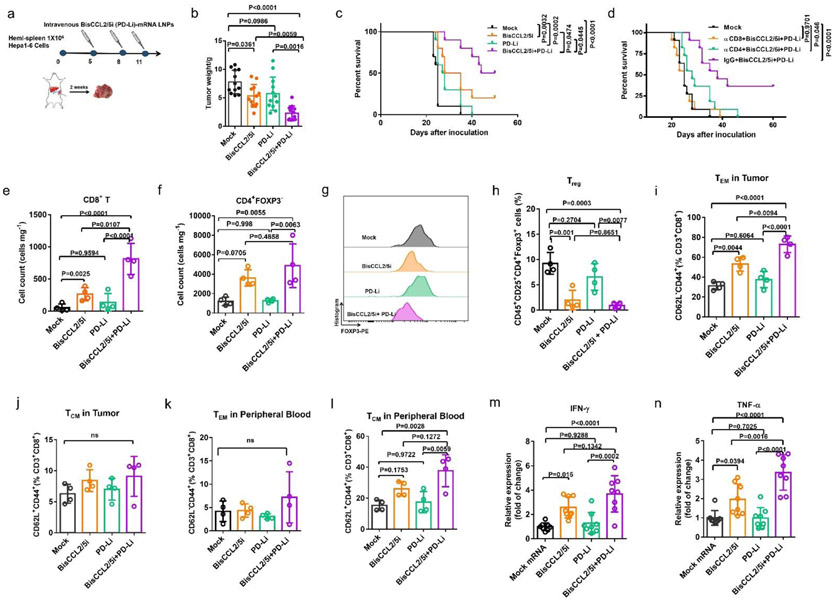
Figure 4. Dual blockade of CCL2 and CCL5 sensitizes HCC tumors to the PD-1/PD-L1 inhibition therapy.
(a) Treatment scheme for HCC tumors established by hemi-spleen approach. (b) Average tumor weight of different treated groups. n = 12 biologically independent samples; one-way ANOVA and Tukey’s multiple comparisons test. (c) Kaplan-Meier survival curve in different treated groups. n = 10 biologically independent samples; Log-rank (Mantel-Cox) test. (d) Kaplan-Meier survival analysis of HCC tumor bearing-mice (for CD4+ or CD8+ T-cell depletion and BisCCL2/5i plus PD-Li treatments). n = 11 biologically independent samples; Log-rank (Mantel-Cox) test. (e-l) Change of the immunocellular composition in the HCC TME 4 days following Mock mRNA-LNPs and BisCCL2/5i mRNA-LNPs treatments (mRNA: 1 mg/kg), measured by flow cytometry (n = 4 biologically independent samples; one-way ANOVA and Tukey’s multiple comparisons test). (e-f) The counts of total CD8+ T (e) cells and CD4+FOXP3− T cells (f) in the HCC tumor site. (g-h) Representative flow cytometry histograms of FOXP3 expression (g) and the percentage of Treg cells (h) in the CD4+ T cells. (i-j) The percentages of effector memory CD8+ T cells (TEM) (i) and central memory CD8+ T cells (TCM) (j) in the CD8+ T population in HCC TME. (k-l) The percentages of CD8+ TEM cells (i) and CD8+ TCM cells (j) in the CD8+ T population in peripheral blood. (m-n) Relative expressions of IFN-γ and TNF-α cytokines in HCC TME 4 days following indicated treatments, detected by quantitative RT-PCR (n = 8 biologically independent samples; one-way ANOVA and Tukey’s multiple comparisons test). CD8+ T (CD45+CD3+CD8+); CD4+ T (CD45+CD3+CD4+); Treg (CD45+CD3+CD4+CD25+FOXP3+), CD8+ TEM (CD44+CD62L− gated from CD3+CD8+ T cells), CD8+ TCM (CD44+CD62L+gated from CD3+CD8+ T cells). Data are represented as the mean ± s.d.

