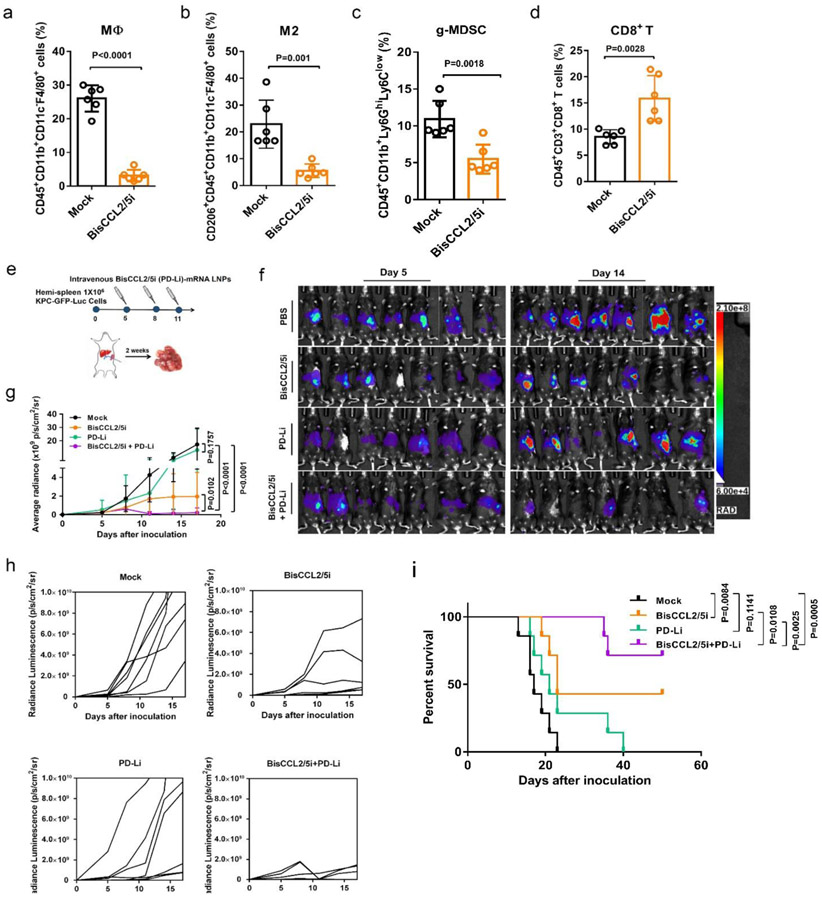
Figure 5. Dual blockade of CCL2 and CCL5 sensitized KPC liver metastasis tumor to PD-1/PD-L1 inhibition therapy.
(a-d) Change of the immunocellular composition in the KPC liver metastatic TME 48 hr following Mock mRNA and BisCCL2/5i mRNA-LNPs treatment (mRNA: 1 mg/kg, i.v.), measured by flow cytometry (n = 6 biologically independent samples; unpaired two-tailed Student’s t-test). The percentage of macrophages (a), M2-phenotype macrophages (b), and g-MDSC (c) in the total immune cells. The percentage of CD8+ T cells in the CD3+ cells (d). (e) Treatment scheme for KPC liver metastasis tumors administered intravenously with various formulations (mRNA: 1 mg/kg). (f-g) In vivo bioluminescence imaging (f) and tumor growth burden (g) of mice bearing KPC liver metastasis receiving various treatments (n = 7 biologically independent samples; two-way ANOVA with multiple comparisons). The experiments were conducted twice independently with similar results. (h) Spider plots of individual tumor growth curves (n = 7 biologically independent samples in each group). (i) Kaplan-Meier survival analysis of KPC liver metastasis tumor bearing-mice after indicated treatments. n = 8 biologically independent samples; Log-rank (Mantel-Cox) test. Data are represented as the mean ± s.d.

