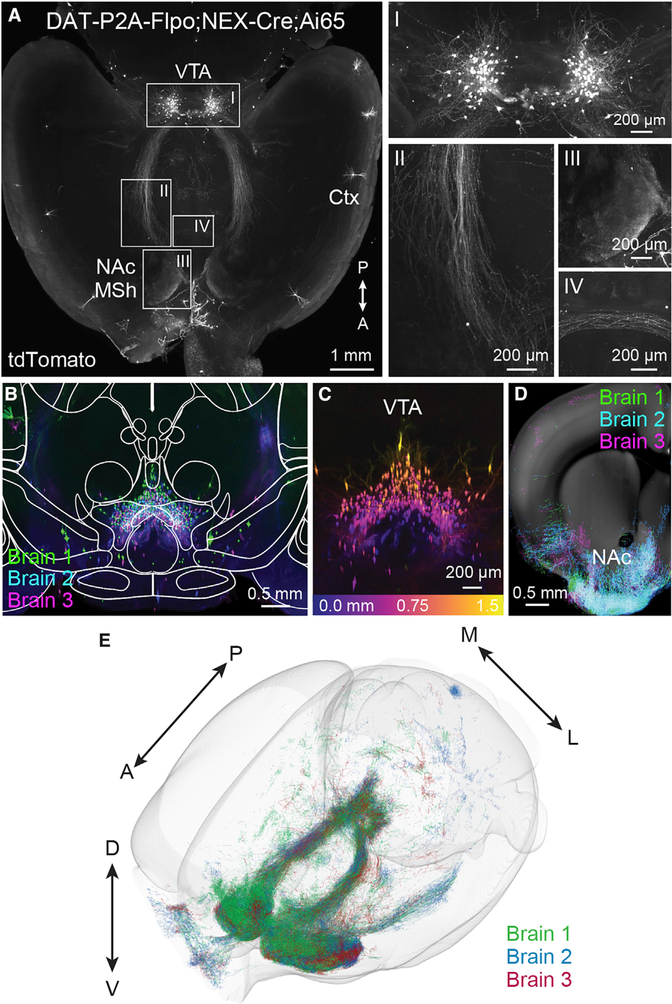
Figure 5. Whole-brain imaging of DAT-P2A-Flpo;NEX-Cre;Ai65 mice.
(A) Whole brains from 2 male and 1 female P120 DAT-P2A-Flpo;NEX-Cre;Ai65 mice were optically cleared and imaged without sectioning using a light sheet microscope. Shown is a representative max projection of 600 μm from a horizontal plane z stack (representative of 3 mice). Right panels show zoomed-in images of Neurod6+ DA neurons in the midbrain (I), axonal tracts from the midbrain to the NAc MSh (II), Neurod6+ DA neuron axon terminals in the MSh (III), and fibers crossing the midline (IV). Ctx, cortex.
(B) Coronal view (XZ projection) comprising a 1.5 mm anterior/posterior (A/P) cross section of the VTA in optically cleared DAT-P2A-Flpo;NEX-Cre;Ai65 mice. Three separate brains were aligned and merged. Image is overlaid with brain region outlines from the middle position of the 1.5 mm cross section from the Allen Brain Atlas.
(C) Coronal z stack image of a 1.5 mm cross section of the VTA from a single brain color coded by depth. Depth scale is shown in bottom panel.
(D) Coronal z stack image of TrailMap-extracted axons from a 500 μm section of the striatum and NAc. Three separate brains were aligned and merged. Extracted axons are overlaid onto a reference slice from the middle position of the 500 μm section from the Allen Brain Atlas.
(E) Projections and processes of DAT-P2A-Flpo;NEX-Cre;Ai65-positive neurons visualized in a 3D view of TrailMap-extracted processes from three aligned brains.

