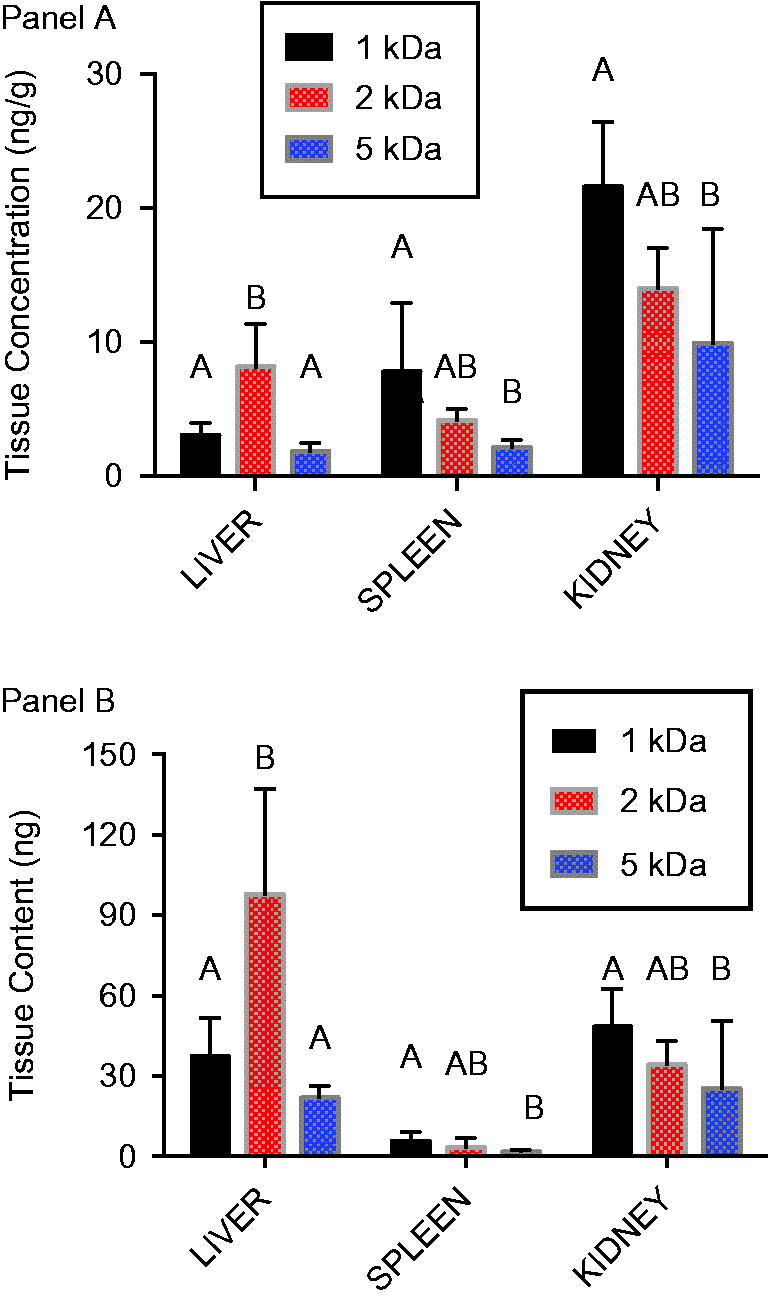
Figure 5.

Tissue distribution of 1, 2 and 5 kDa PEG-coated 5 nm AuNPs following oral administration. Gold content was measured in liver, spleen, and kidney at sacrifice 48 h after an oral dose (8.0 mg/kg) of either 1, 2 or 5 kDa PEG-coated 5 nm AuNPs. A) Gold concentration in tissues. B) Mass of gold in the tissue based upon tissue concentration and total weight of the organ. Results are presented as mean ± SD, N = 5. Bars with letter superscripts (A, B or AB) denote significant differences among PEG-coated particle types; bars with different letter superscripts are significantly different p < 0.05.
