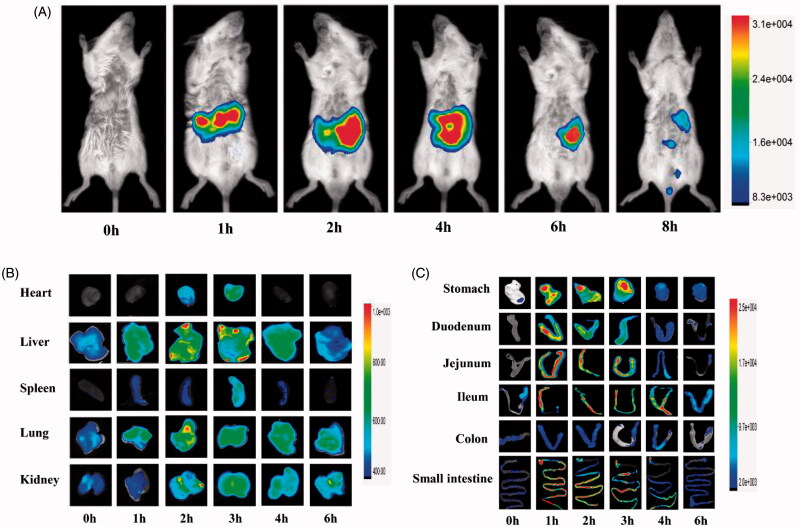
Figure 2.
In vivo biodistribution profile of cASP orally administered, in healthy mice. (A) Fluorescence intensity images of mice whole body from 0 to 8 h. (B) Ex vivo imaging of major organs (heart, liver, spleen, lung, kidney) from 0 to 6 h. (C) Ex vivo imaging of gastrointestinal tract from 0 to 6 h.

