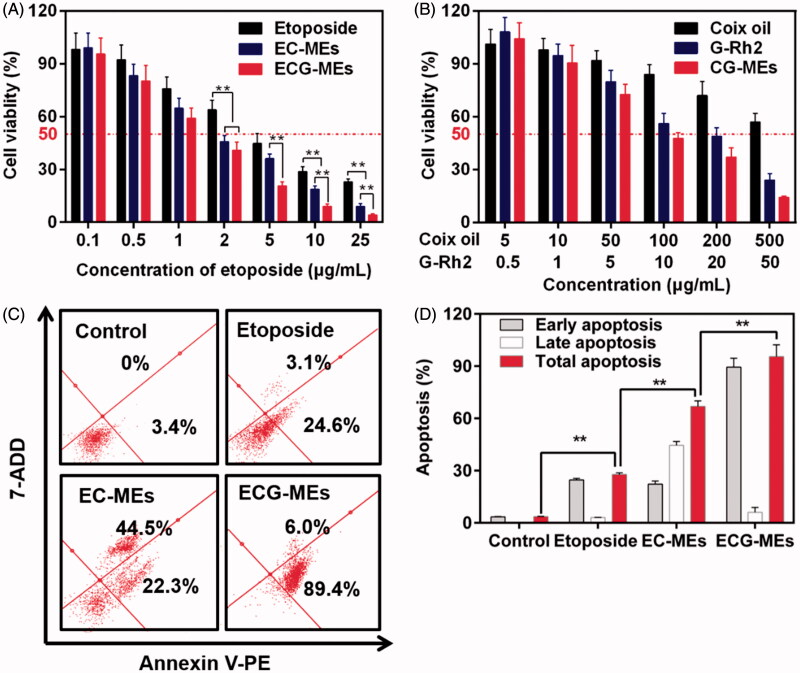
Figure 5.
(A,B) Cytotoxicity of different treatments against A549 cells for 48 h. **p < .01, all the data are presented as mean ± SD (n = 6). (C,D) A549 cell apoptosis induced by different etoposide formulations. (C) In each quadrant of apoptosis, the upper right and lower right zones represent the late apoptosis and the early apoptosis, respectively. (D) The quantification of cell apoptosis rate after various treatments. **p < .01, all the data are presented as mean ± SD (n = 4).

