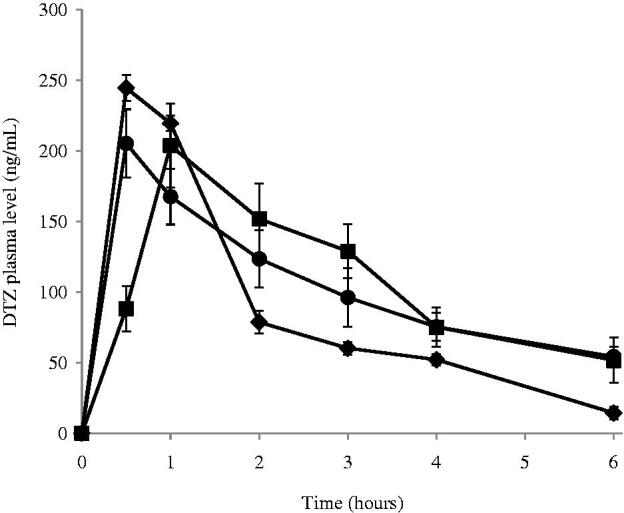
Figure 4.

Plasma concentration following the administration of (•) F3; (▪) F7 and (♦) control drug solution by intranasal route at the amount of 250 μg/Kg of DTZ in male Wistar rats. Blood was collected before administration at t tm0 and after administration at t = 30 min, 1, 2, 3, 4 and 6 h. Points represent the mean ± standard deviation for n =6 per group.
