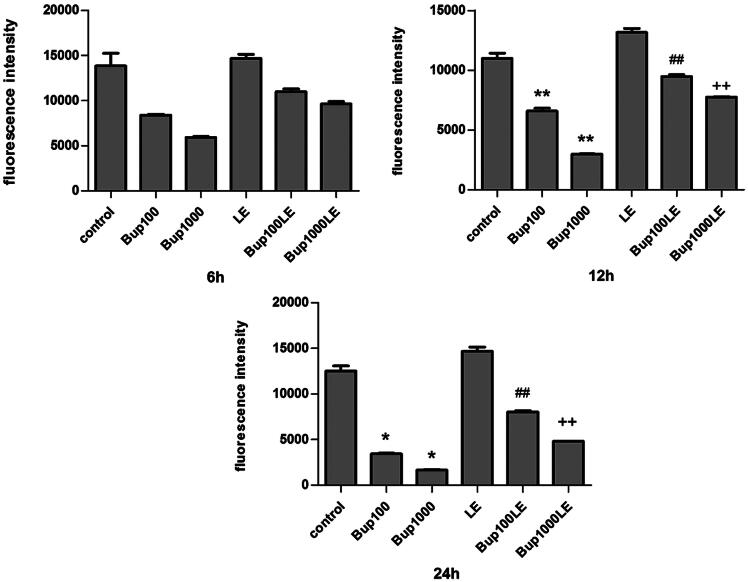
Figure 3.
Mitochondrial membrane potential was measured using DiBAC4(3) and detected by flow cytometry. The fluorescence was blue-green and fluorescence intensity was detected after cells were incubated for 6 h, 12 h, and 24 h. Date represented are mean ± SD of 3 separate experiments. *p < 0.05, **p < 0.01 versus the control group. ##p < 0.01 versus group Bup100. ++p < 0.01 versus group Bup1000.

