Figure 3.
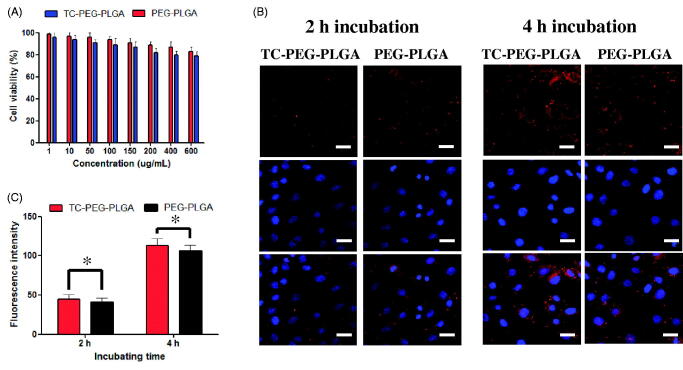
In vitro study of TC-PEG-PLGA micelles. (A) Viability of MC3T3-E1 cells after exposure to PEG-PLGA micelles or TC-PEG-PLGA (mean ± SD, n = 3). (B) Fluorescence images of MC3T3-E1 cells were incubated with DiD-loaded PEG-PLGA and TC-PEG-PLGA micelles for 2 and 4 h, respectively (scale bar =25 mm). (C) Quantitative results of cellular uptake measured by flow cytometry. *p > 0.05.

