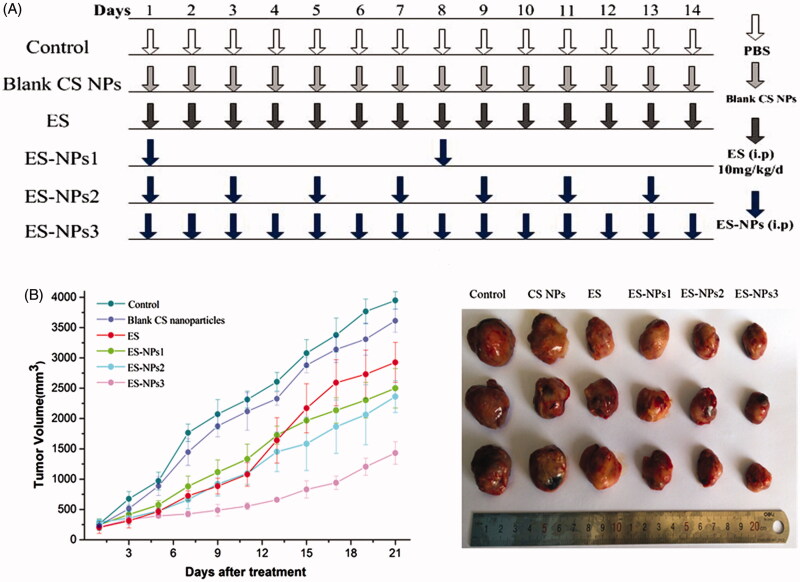
Figure 4.
Tumor volume changes in each group. (A) Treatment schedule. Two weeks after inoculation, the tumor-bearing mice were randomly assigned to six groups: control, ES, ES-NPs1, ES-NPs2, ES-NPs3 and blank CS nanoparticles (n = 10). (B) Tumor growth curve in each group. (C) The final tumor volume on day 21.

