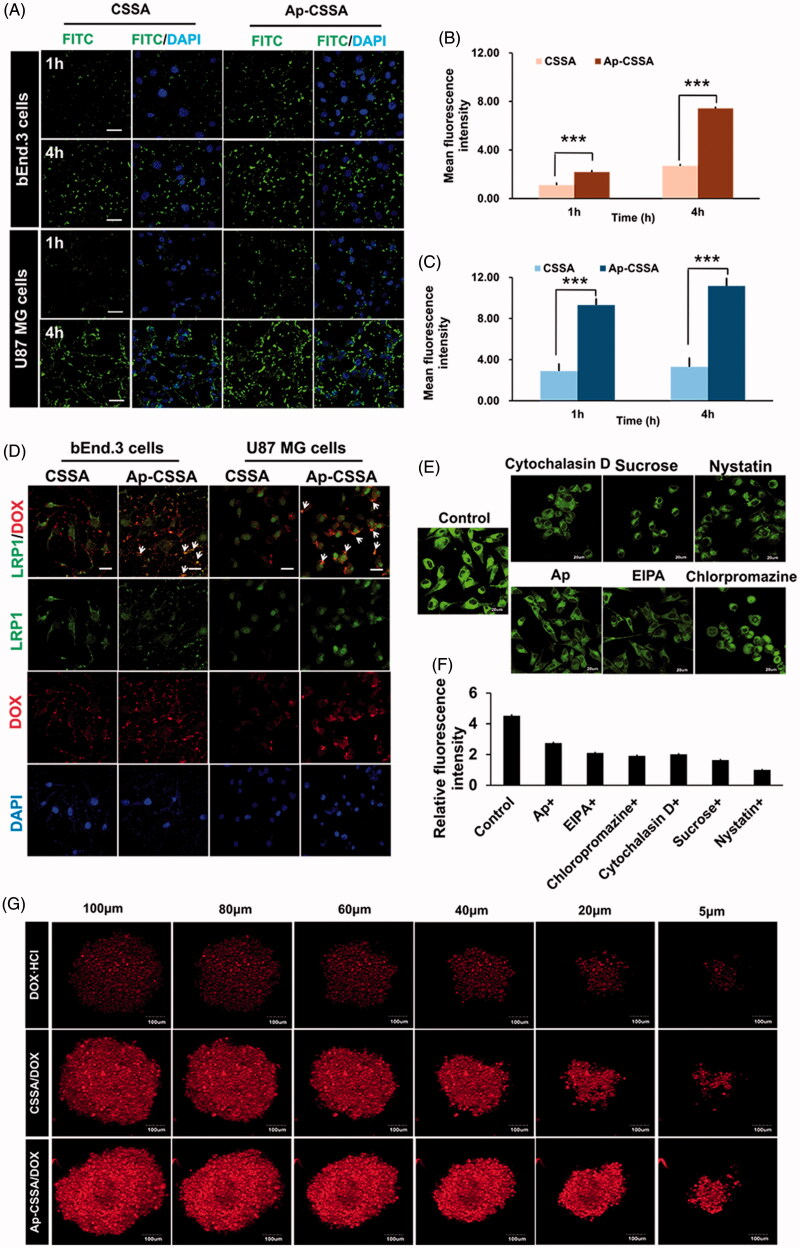
Figure 2.
Cellular targeting uptake. (A) Intracellular fluorescence distribution in bEnd.3 cells and U87 MG cells after incubated with FITC-labeled CSSA and Ap-CSSA copolymer micelles for 1 h and 4 h. The nuclei were stained with DAPI (blue) (Scale bar =20 μm). Mean fluorescence intensity of FITC-labeled vehicles uptake in bEnd.3 cells (B) and U87 MG cells (C) measured by flow cytometer (n = 3). (D) In vitro colocalization of CSSA/DOX nanoparticles, Ap-CSSA/DOX nanoparticles with LRP1 in bEnd.3 cells and U87 MG cells. The white arrows show co-localized (yellow) of DOX-loaded nanoparticles (red) and LRP1 receptors (green) (Scale bar =30 μm). (E) The effect of different endocytosis inhibitors on Ap-CSSA copolymer micelles treated U87 MG cells (F) and relative fluorescence intensities revealing the extent of cellular uptake in each studied group. (G) Total fluorescence intensity of DOX·HCl, CSSA/DOX nanoparticles and Ap-CSSA/DOX nanoparticles on U87 MG tumor spheroid for 1 h at certain depths.

