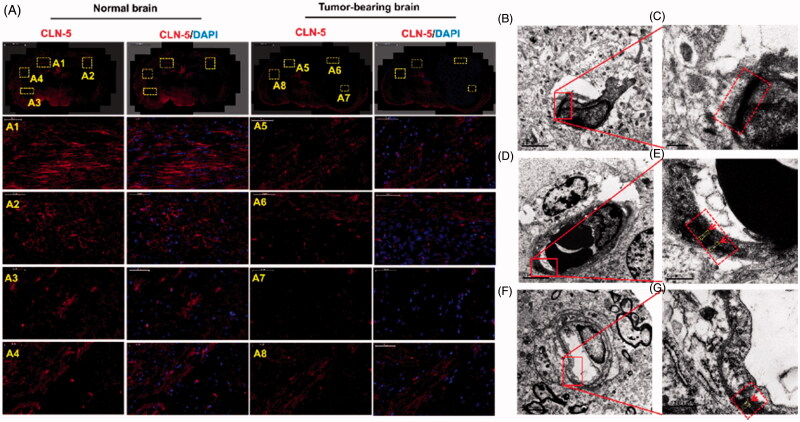
Figure 4.
Disruption of TJs led to BBB breakdown, together with an increased bio-distribution of Ap-CSSA in vivo. (A) Confocal x–y–z scanning images of normal brain tissue section (A1–A4) and GBM-bearing brain (A5–A8), immune-stained for claudin-5 (red) and nuclear (blue) (Scale bar =50 μm). Ultrastructure of TJs in normal brain tissues (B, C), brain tumor (D, E) and the margin tissues of brain tumor (F, G) by TEM.

