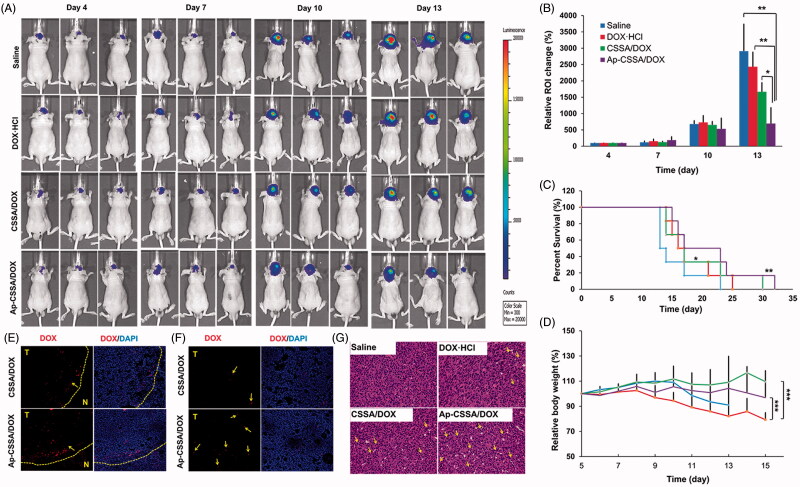
Figure 6.
Antitumor activity. (A) In vivo bioluminescence imaging of U87-luci bearing nude mice at different time points after treatment (day 4, 7, 10, 13). (B) Quantitative of signals from the entire abdominal region of each mouse (n = 3). (C) Kaplan–Meier survival curves (n = 6). (D) Body weight changes exposed to various treatment (n = 6). In vivo distribution of DOX-loaded nanoparticles in the margin (E) and center areas (F) of the orthotopic brain tumor. (G) H and E staining of brain tumor sections and heart sections after the i.v. injection with saline, DOX·HCl, CSSA/DOX and Ap-CSSA/DOX nanoparticles, respectively.

