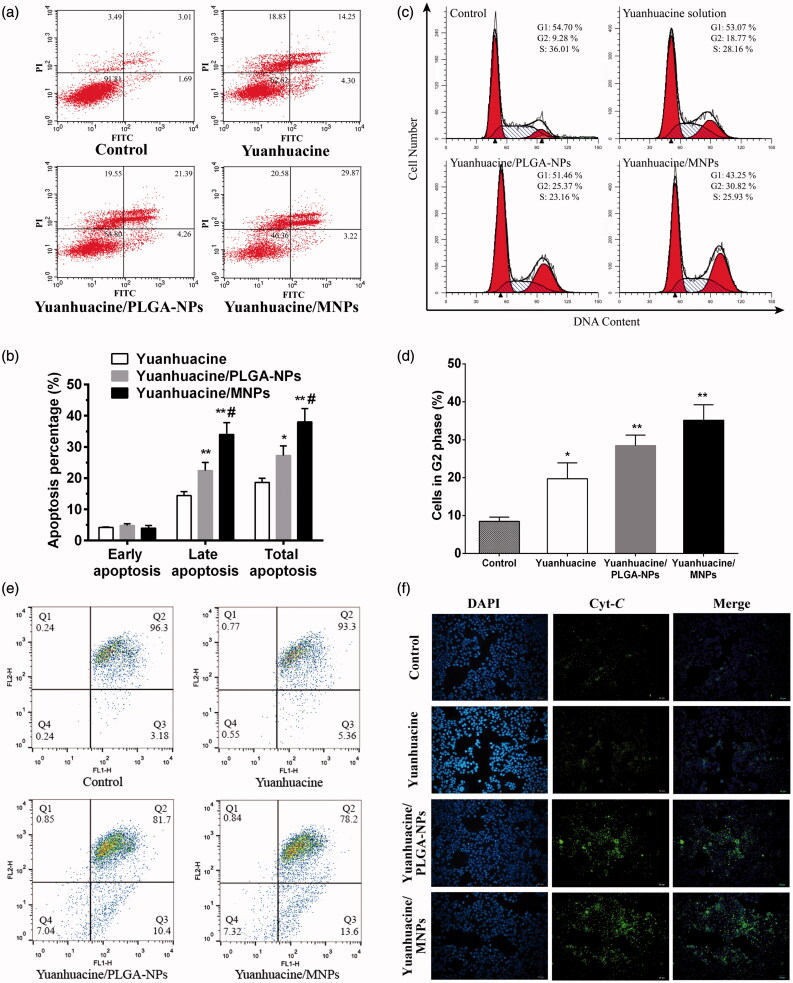
Figure 5.
(a) Flow cytometric images to detect apoptosis and (b) apoptosis percentage on A549 cells after applying yuanhuacine, yuanhuacine/PLGA-NPs, and yuanhuacine/MNPs with yuanhuacine concentration of 10 μM for 24 h. *p < .05, **p < .01 versus yuanhuacine, #p < .05 versus yuanhuacine/PLGA-NPs. (c) Cell cycle and (d) cell percentage in G2 phase on A549 cells after applying yuanhuacine, yuanhuacine/PLGA-NPs, and yuanhuacine/MNPs with yuanhuacine concentration of 10 μM for 24 h. *p < .05, **p < .01 versus control. (e) Mitochondrial membrane potential measurement and (f) cytochrome c detection on A549 cells after applying yuanhuacine, yuanhuacine/PLGA-NPs and yuanhuacine/MNPs at a yuanhuacin concentration of 10 μM for 24 h.

