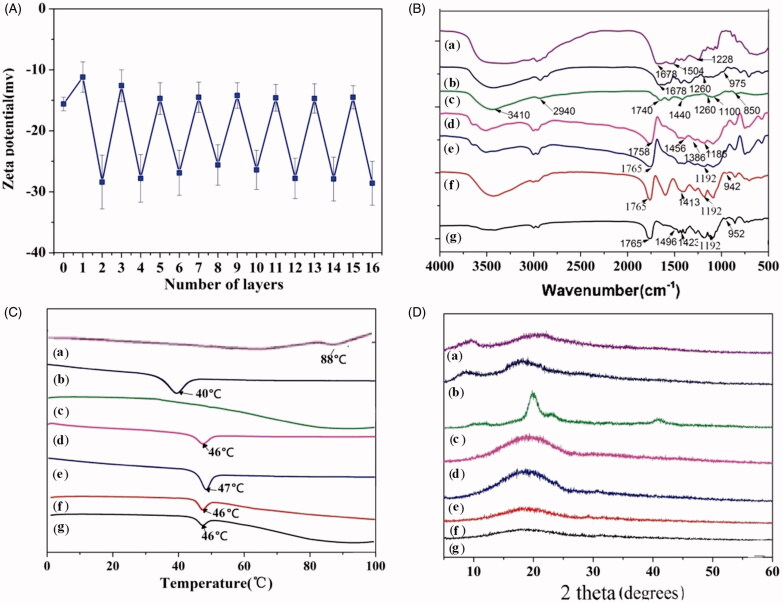
Figure 3.
Characterization of the multilayer microspheres. (A) The change in zeta potential during the LbL process; (B) FTIR spectra; (C) DSC traces (exo up); (D) XRD patterns. Legend: (a) Insulin; (b) p(AAPBA-co-NVCL); (c) PVA; (d) PLGA; (e) porous PLGA microspheres; (f) multilayer microspheres; and, (g) insulin loaded multilayer microspheres.

