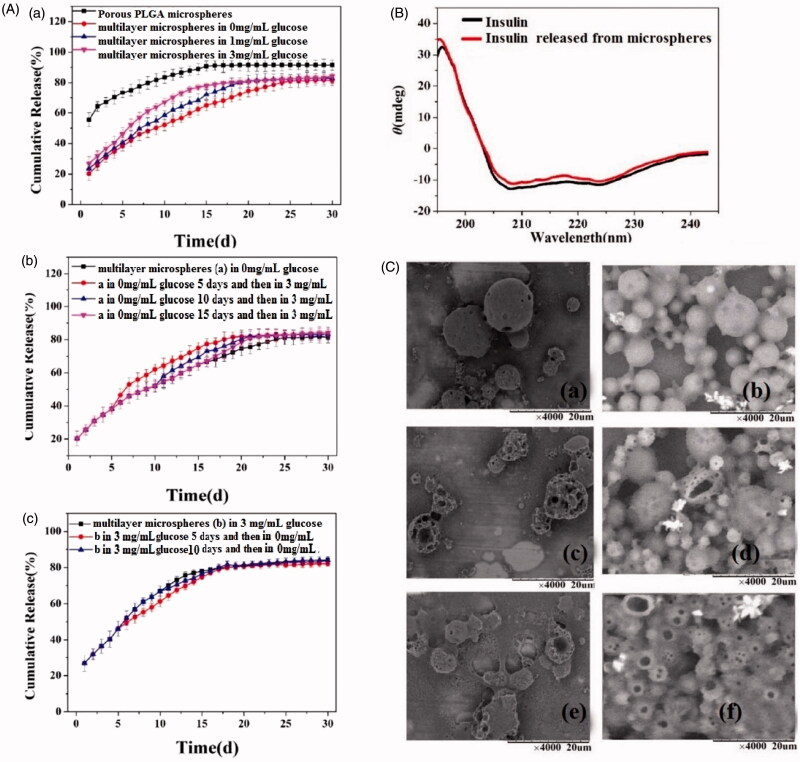
Figure 4.
In vitro drug release from the insulin loaded microspheres. (A) Insulin release at varied glucose concentrations: (a) constant concentration throughout; (b) initially no glucose and then transfer to high-glucose conditions; and (c) Initially high-glucose then transfer to a glucose-free medium. Experiments were performed in triplicate and data are plotted as mean ± SEM. (B) CD spectra of insulin released from the multilayer microspheres after 6 hours and fresh insulin. (C) SEM images of the particles after insulin release for 5, 15 and 25 days from (a, c and e) the porous PLGA microspheres and (b, d and f ) multilayer microspheres.

