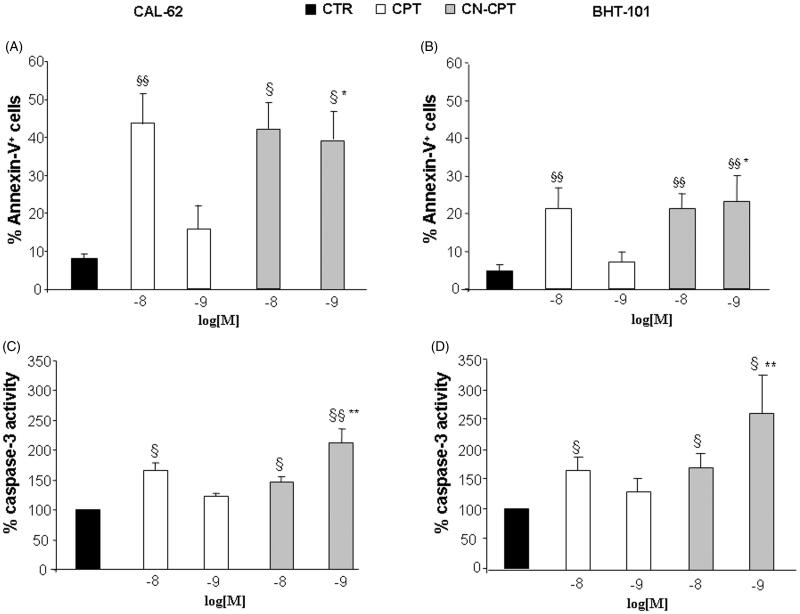
Figure 3.
Proportions of Annexin-V-positive cells and levels of caspase-3 activity after CPT or CN-CPT treatment. Annexin-V-positive cells (A, B) and caspase-3 activity (C, D) was evaluated in CAL-62 (A, C) and BHT-101 (B, D) cells cultured for 48 h in the presence or absence of CPT or CN-CPT. CPT and CN-CPT were replenished every 24 h (48 h culture: 24 + 24 h) without changing the culture medium. Results are expressed as % of Annexin-V-positive cells and relative caspase activity %, calculated as result displayed by each treatment/the results displayed by untreated cells (n = 5). §p < 0.05; §§p < 0.01, significantly different from untreated cells; *p < 0.05; **p < 0.01, significantly different from treated cells at the same drug concentration.

