Figure 2.
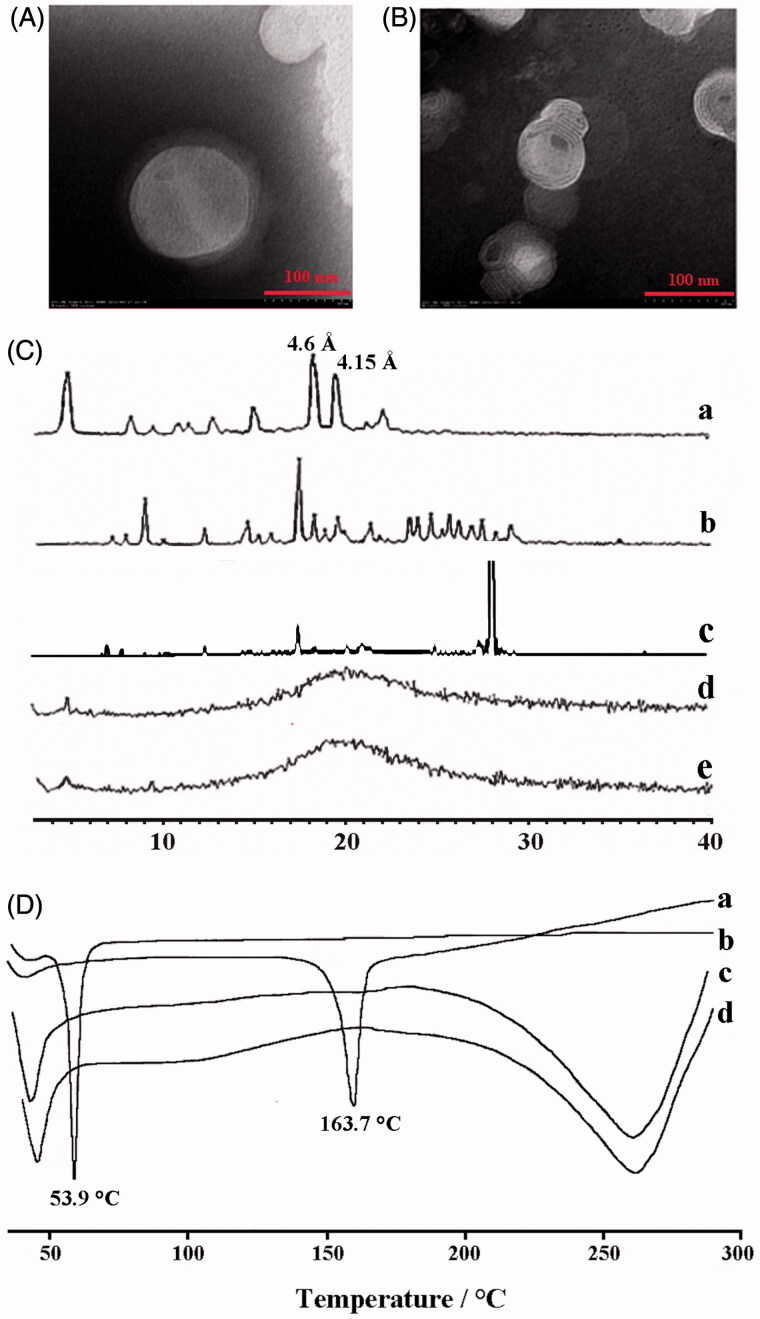
The TEM images of (A ) Cur-NLC and (B) Cur-NAPG50-NLC; (C) Power X-ray diffraction patterns of: Cholesterol oleate (a), Cur (b), physical mixture of Cur and NAPG50-NLC (c), blank NAPG50-NLC (d) and Cur-NAPG50-NLC (e); (D) DSC curves of: Cur(a), NAPG (b), blank-NAPG50-NLC (c) and Cur-NAPG50-NLC (d).

