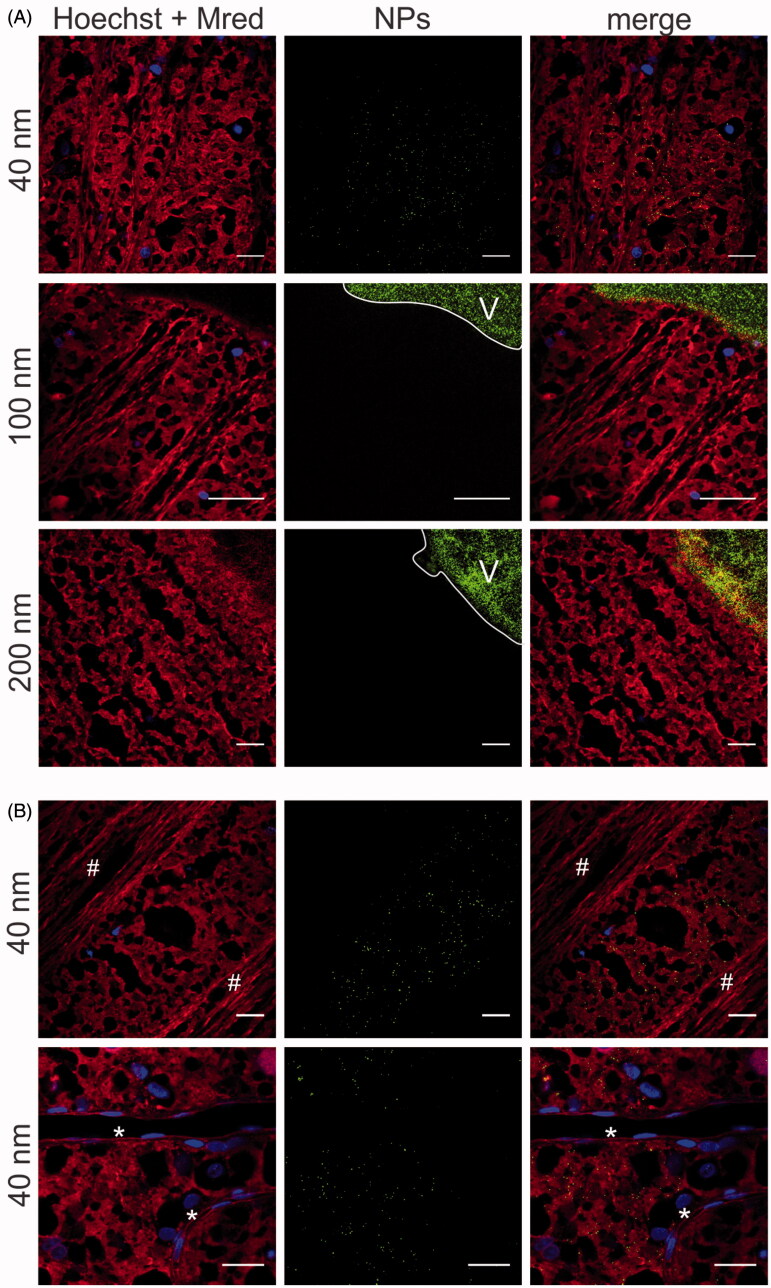
Figure 5.
Transfer of (green) PS beads through the VR interface, as visualized by ‘direct imaging’ (Figure 2B). Müller cells (red) are stained with Mitotracker Deep Red, cell nuclei (blue) with Hoechst. (A) 40 nm particles enter the Müller cells, 100 and 200 nm particles remain in the vitreous (indicated with ‘V’). Scale bar: 25 µm. For optimal contrast we refer the reader to the online version. (B) Co-localization of 40 nm PS beads (green) with Müller cells. Asterisks (*) indicate blood vessels, number signs (#) indicate nerve fibers. Scale bar: 25 µm.

