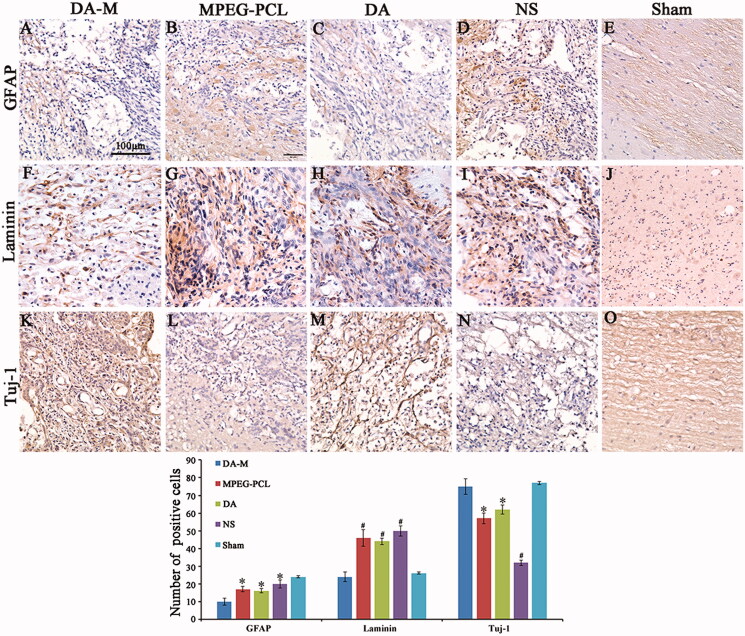
Figure 9.
(A–E). GFAP, (F–J) Tuj-1 and (K–O) laminin immunohistochemical analysis. Spinal cord sections from the groups treated with intravenous DA-M, free DA, blank MPEG-PCL micelles and normal saline (NS) were subjected to immunohistochemistry to detect GFAP, Tuj-1 and laminin. (P) Quantification comparison of GFAP, laminin and Tuj-1positive cells in DA-M-treated and other groups. Significance was assessed by one-way analysis of variance. Quantitative data are represented as mean ± SD. p Values less than 0.05 were considered significant (*p < 0.05, #p < 0.01). Scale bars represent 100 μm.

