Figure 1.
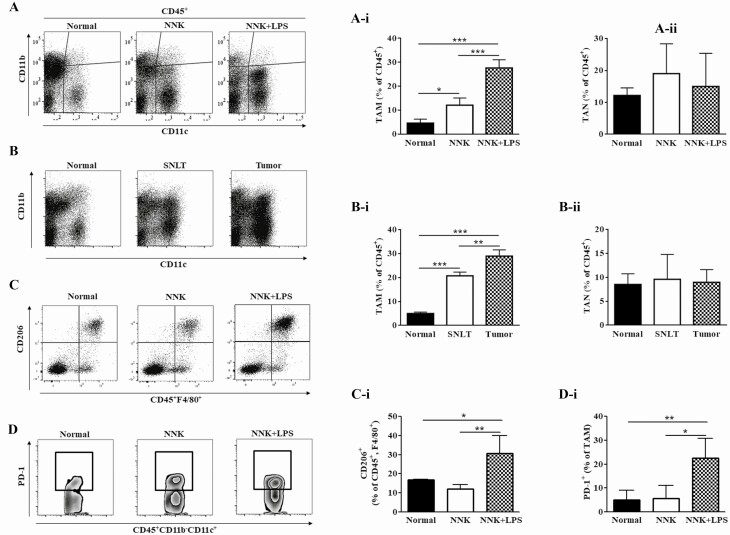
Differential infiltration of NNK- and NNK+LPS-induced lung tumors by macrophages. (A and B) Representative flow cytometry plots showing the relative abundance of TAMs (CD45+ CD11b− CD11c+) and TANs (CD45+ CD11b+ Ly6G+) in NNK+LPS-induced lung tumors, NNK-induced lung tumors and normal lung tissue from vehicle-treated mice (A) or NNK+LPS-induced lung tumors, SNLT of these tumors and normal lung tissues from the vehicle group (B). Quantification of TAMs (A-i and B-i) and TANs (A-ii and B-ii) in the different lung tissues as determined by flow cytometry (mean ± SEM, P < 0.05). (C and D) Abundance of M2 TAMs (CD45+ F4/80+ CD206+; C) and PD-1+ TAMs (CD45+ CD11b− CD11c+ Ly6G+ PD-1+, D, D-i) in the different groups of mice. Flow cytometry analysis was carried out at least three times and each time two mice (vehicle group) or two to three mice (NNK- or NNK+LPS-treated mice) were used.

