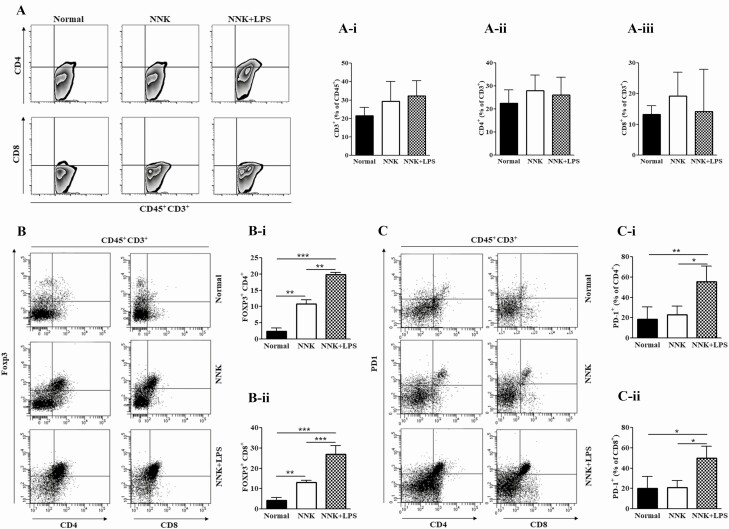
Figure 2.
Infiltration of lung tumors by T lymphocytes. (A–C) Representative flow cytometry plots for CD3+, CD4+ and CD8+ T cells (A), FOXP3+ T cells (B), and CD4+ PD-1+ and CD8+ PD-1+ (C) T cells within lung tissues of the different groups of mice. (A-i–C-ii) Quantification of CD3+, CD4+ and CD8+ T cells (Ai, Aii and A-iii, respectively), FOXP3+ CD4+ (B-i), FOXP3+ CD8+ (B-ii), PD-1+ CD4+ (C-i) and PD-1+ CD8+ (C-ii) T cells within lung tissues of the different groups of mice. Flow cytometry analysis was carried out at least three times and each time two mice (vehicle group) or two to three mice (NNK- or NNK+LPS-treated mice) were used. Data represent mean ± SEM; P < 0.05.

