Figure 3.
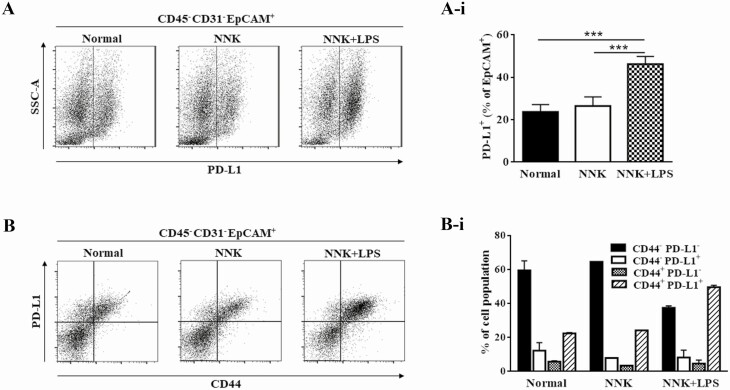
Differential expression of PD-L1 by NNK- and NNK+LPS-induced lung tumors. (A and B) Representative flow cytometry plot for CD45− CD31− EPCAM+ PD-L1+ (A) and CD45− CD31− EPCAM+ PD-L1+ CD44+ (B) lung cells in lung tissues of the different groups of mice. (A-i and B-i) Quantification of CD45− CD31− EPCAM+ PD-L1+ (A-i) and CD45− CD31− EPCAM+ PD-L1+ CD44+ (B-i) lung cells by flow cytometry within normal lung tissues from vehicle-treated mice and NNK- or NNK+LPS-induced lung tumors. Flow cytometry analysis was carried out with two mice for the vehicle group and three mice each for the NNK and NNK+LPS groups with the exception of B-i results in which the NNK data were collected only from one mouse. Data represent mean ± SEM; P < 0.05.

