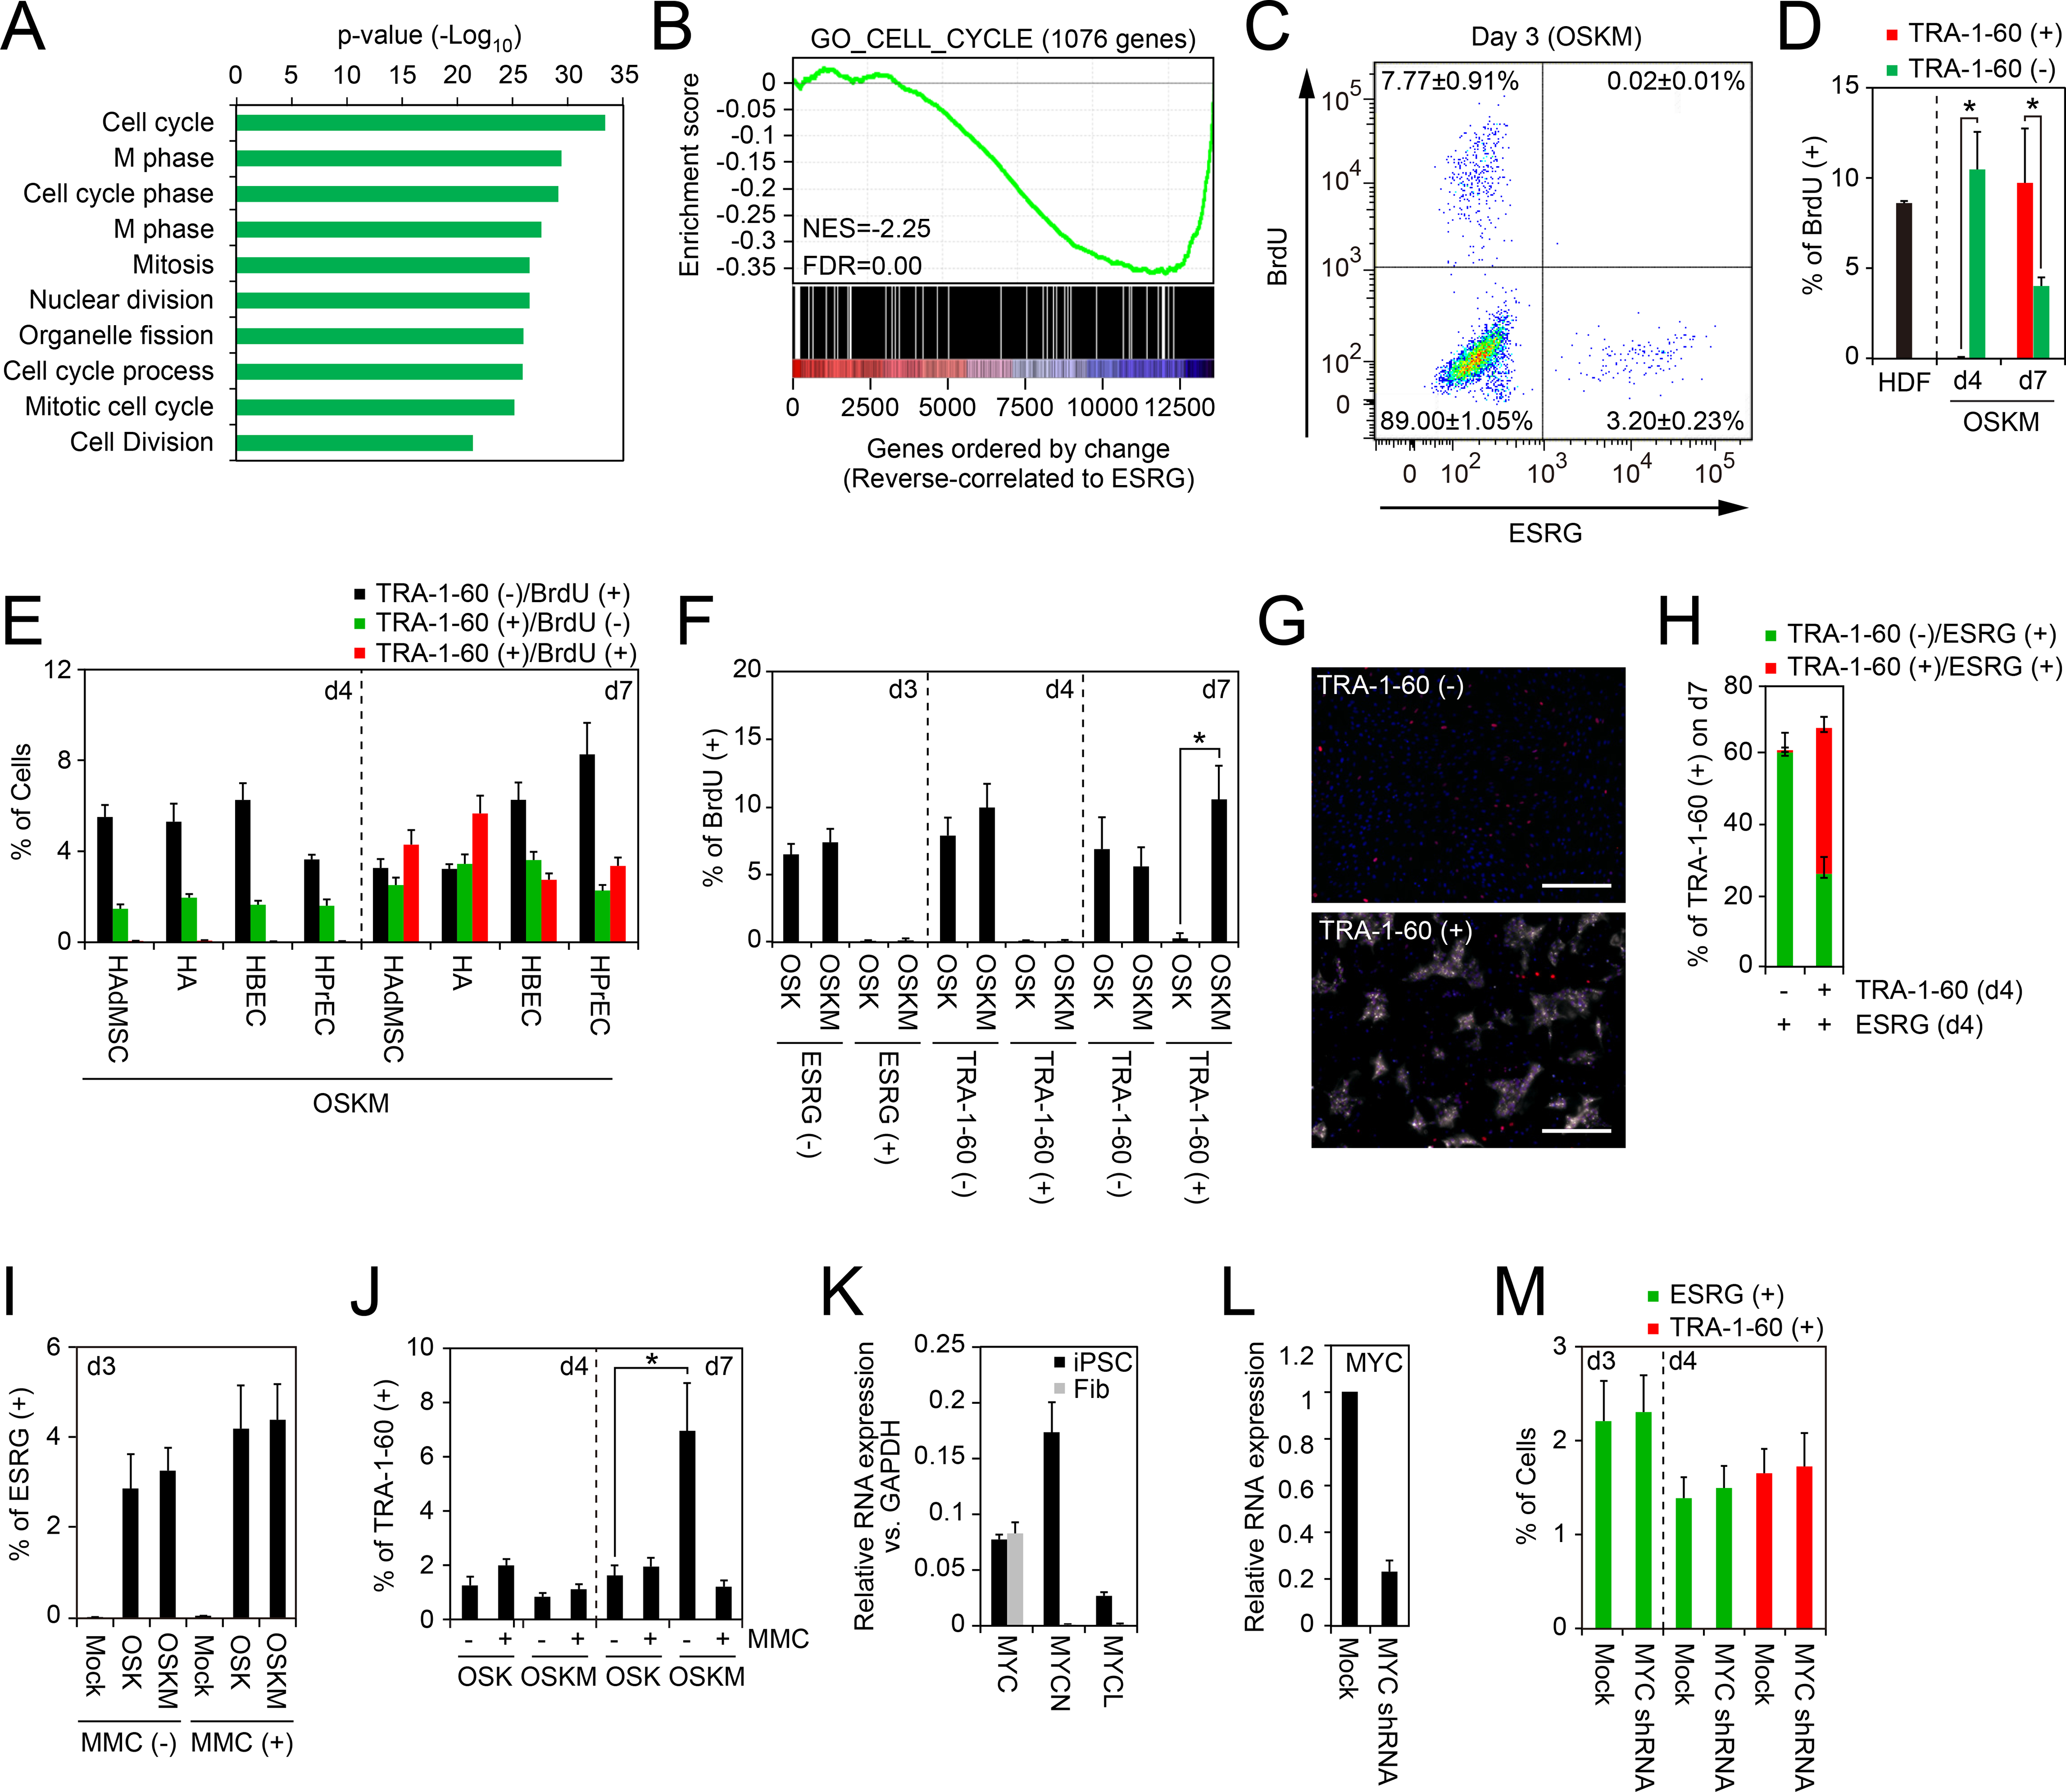
Figure 2: Cell-Cycle Progression Is Dispensable for Initiating Reprogramming.

A, Gene ontology analyses of genes varied according to ESRG. Top 200 genes reverse-correlated to ESRG were classified by the gene ontology analysis. The p-values of top 10 enriched terms are shown. See also Table S3.
B, Gene Set Enrichment Analysis showing enrichment of cell-cycle-related genes in the set of genes that show reverse correlation with ESRG expression. X-axis shows genes ranked by Pearson correlation coefficient for ESRG expression. Left, positively correlated genes; right, negatively correlated genes. See also Table S3.
C, Proliferation of ESRG (+) cells. Shown is a representative histogram of the BrdU incorporation of OSKM-transduced ESRG-Clover fibroblasts on day 3. n=3.
D, Proliferation of newly converted TRA-1–60 (+) cells from HDFs. Shown are the percentages of the BrdU incorporation of parental HDFs (d0), TRA-1–60 (+) or (−) cells on days 4 (d4) or 7 (d7). *p<0.05 by unpaired t-test (n=3).
E, Proliferation of newly converted TRA-1–60 (+) cells from other cell types. Shown are the percentages of TRA-1–60 (+)/BrdU (−) (black), TRA-1–60 (+)/BrdU (+) (red) or TRA-1–60 (−)/BrdU (+) cells on days 4 (d4) or 7 (d7). n=3.
F, MYC enhances the proliferation of TRA-1–60 (+) cells. Shown are the percentages of BrdU (+) incorporation in ESRG (+) cells on day 3 (d3) and TRA-1–60 (+) cells on days 4 (d4) or 7 (d7) induced by OSK or OSKM. *p<0.05 by unpaired t-test (n=3).
G, MYC does not enhance the continuity of TRA-1–60 conversion. Shown are representative immunocytochemistry images of the cells on day 7 derived from sorted TRA-1–60 (+) or (−) cells in ESRG (+) population on day 4 post-transduction of OSKM stained with TRA-1–60 (white) and OCT3/4 (red) antibodies. Nuclei were visualized by Hoechst 33342 staining. Bars indicate 100 μm.
H, TRA-1–60 (−) cells on day 4 did not convert to TRA-1–60 (+) fate. Shown are quantitative results of ESRG (+)/TRA-1–60 (+) cells (red) and ESRG (+)/TRA-1–60 (−) cells (green) in the cells shown in Figure 2G.
I, Percentages of ESRG (+) cells with or without mitomycin C treatment. Shown are the percentages of ESRG (+) cells from MMC-treated (+) or non-treated (−) ESRG-Clover fibroblasts on day 3 post-transduction of OSKM. n=3. See also Figure S2.
J, MYC does not affect first-emergence of TRA-1–60 (+) cells. The percentage of TRA-1–60 (+) cells from MMC-treated (+) or non-treated (−) HDFs on days 4 and 7 post-transduction of OSK or OSKM. n=3. See also Figure S2.
K, Expression of MYC family genes in iPSCs and fibroblasts. Shown are relative expression of c-MYC, MYCN and MYCL compared to GAPDH expression in iPSC and fibroblasts (Fib) analyzed by qRT-PCR. n=3.
L, Knockdown of c-MYC in fibroblasts. Shown are the expression of c-MYC in fibroblasts which were introduced with empty vector (Mock) or c-MYC shRNA analyzed by qRT-PCR. n=3.
M, Endogenous MYC does not affect the initiation of reprogramming. Shown are the percentages of ESRG (+) cells (green) on days 3 and 4 and TRA-1–60 (+) cells on day 4 induced by OSK with or without MYC shRNA. n=3.
