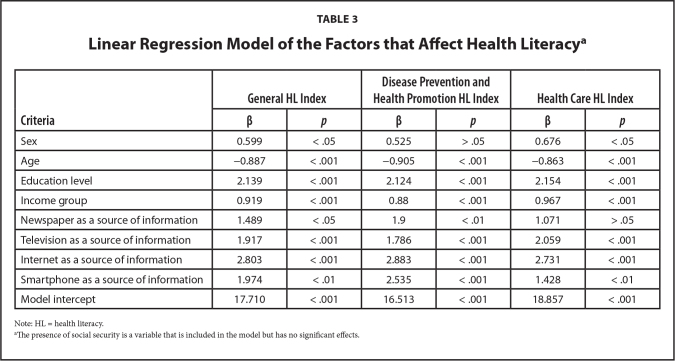
Table 3.
Linear Regression Model of the Factors that Affect Health Literacya
| Criteria | General HL Index | Disease Prevention and Health Promotion HL Index | Health Care HL Index | |||
|---|---|---|---|---|---|---|
| β | p | β | p | β | p | |
| Sex | 0.599 | < .05 | 0.525 | > .05 | 0.676 | < .05 |
| Age | −0.887 | < .001 | −0.905 | < .001 | −0.863 | < .001 |
| Education level | 2.139 | < .001 | 2.124 | < .001 | 2.154 | < .001 |
| Income group | 0.919 | < .001 | 0.88 | < .001 | 0.967 | < .001 |
| Newspaper as a source of information | 1.489 | < .05 | 1.9 | < .01 | 1.071 | > .05 |
| Television as a source of information | 1.917 | < .001 | 1.786 | < .001 | 2.059 | < .001 |
| Internet as a source of information | 2.803 | < .001 | 2.883 | < .001 | 2.731 | < .001 |
| Smartphone as a source of information | 1.974 | < .01 | 2.535 | < .001 | 1.428 | < .01 |
| Model intercept | 17.710 | < .001 | 16.513 | < .001 | 18.857 | < .001 |
Note: HL = health literacy.
The presence of social security is a variable that is included in the model but has no significant effects.

