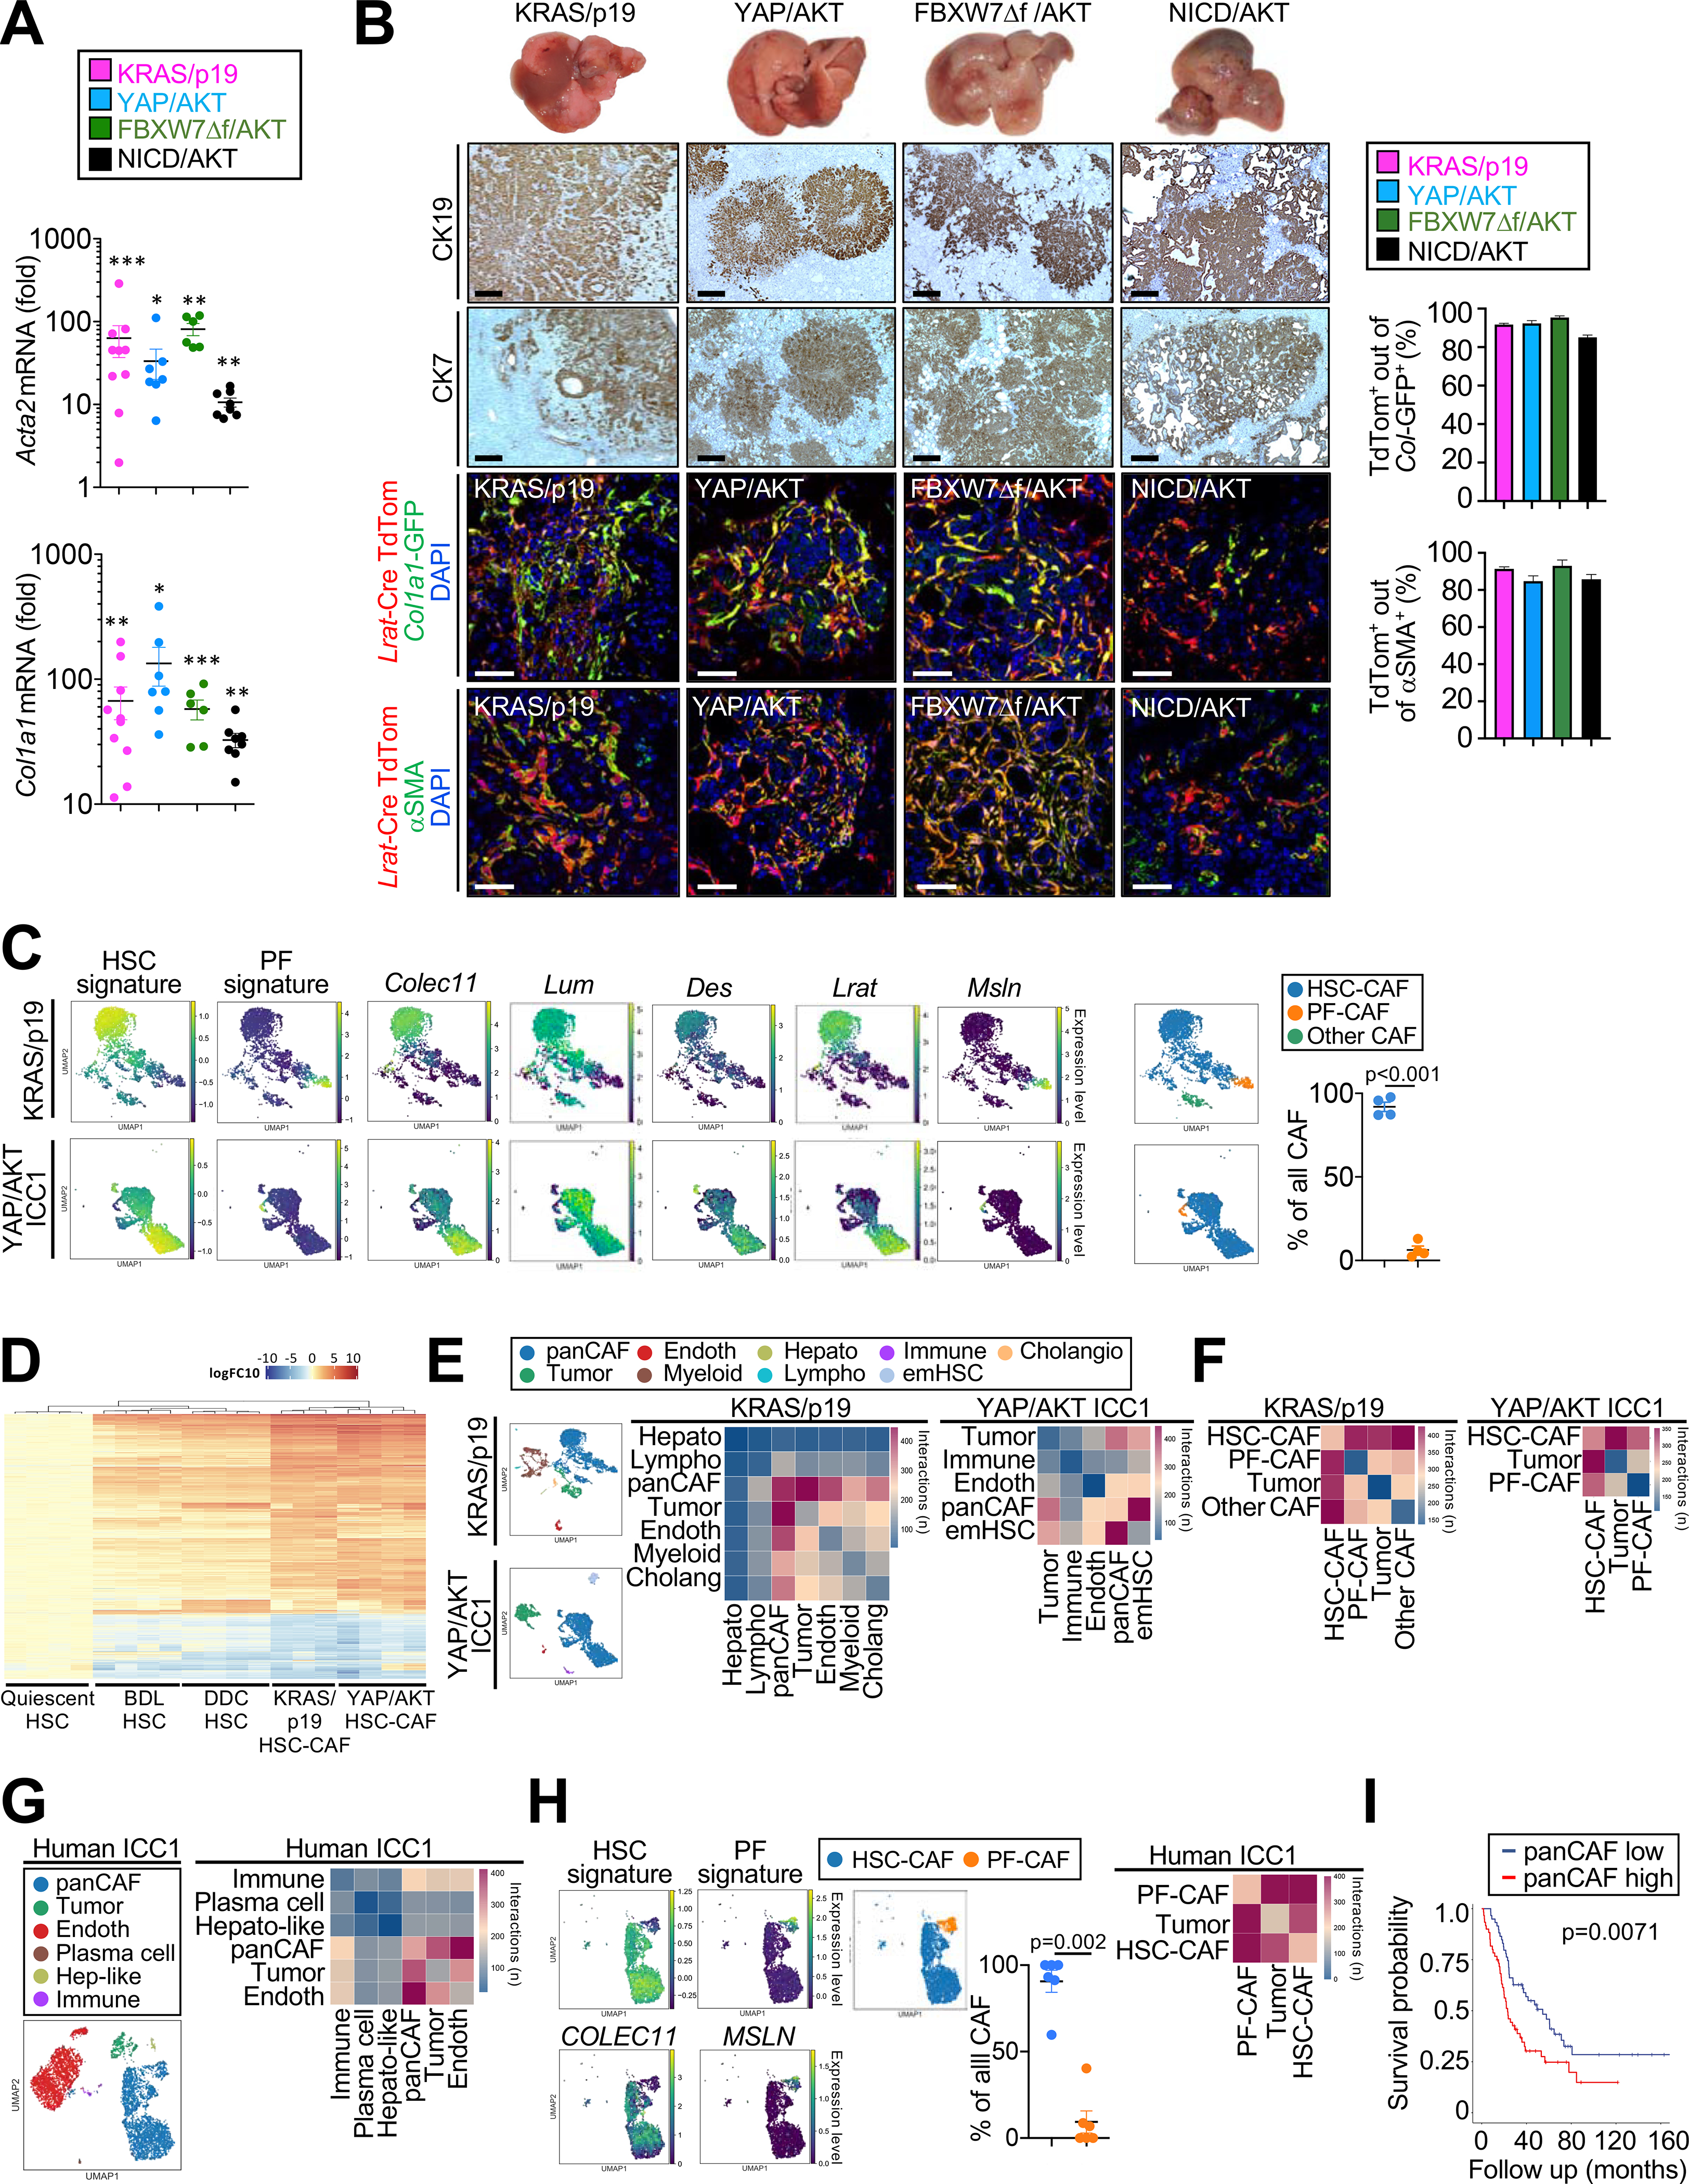
Figure 1 |.

The majority of CAF are HSC derived and closely interact with tumor cells in ICC. (A) Acta2 and Col1a1 mRNA expression in murine ICC. Data are shown as mean±SEM. Significance for each model was calculated by two-sided unpaired T-test or Mann-Whitney test vs its own control, *p<0.05; ** p<0.01; ***p<0.001. (B) Representative photographs, CK19 and CK7 IHC confocal microscopy and quantifications, showing colocalization of Lrat-Cre induced TdTom with CAF markers Col1a1-GFP and αSMA in four murine ICC models (n=3/model) in Lrat-Cre+ TdTom+Col1a1-GFP+ mice. Scale bars, 50 μm. Data shown as mean±SEM. (C) Representative UMAPs of scRNA-seq HSC and PF signature scores HSC markers Colec11, Lum, Des and Lrat, and PF marker Msln in KRAS/p19 (n=1) and YAP/AKT-induced ICC (n=3) and the percentage of CAF populations. (D) Heatmap of genes from bulk RNA-seq with > 2log fold change and p-value <0.01 in quiescent HSC (n=4), HSC from bile duct ligation (BDL) (n=4), HSC from 0.1% DDC diet (n=4), HSC-CAF from YAP/AKT (n=4) and KRAS/p19 (n=3) when compared to qHSC (n=4). (E,F) CellphoneDB analysis showing the number of ligand–receptor interactions between (E) all cell populations and (F) HSC-CAF and PF-CAF with tumor cells in KRAS/p19- and YAP/AKT-induced ICC. (G-H) Representative UMAPs and heatmaps of scRNA-seq showing (G) cell populations and the number of ligand–receptor interactions between all cells, (H) HSC and PF signature scores and percentage (n=6); and number of ligand–receptor interactions (n=5) in human ICC. Data shown as mean±SEM. Significance calculated by Mann-Whitney test. (I) Overall survival in 119 ICC patients with low (n=59) and high (n=60) panCAF signature.
